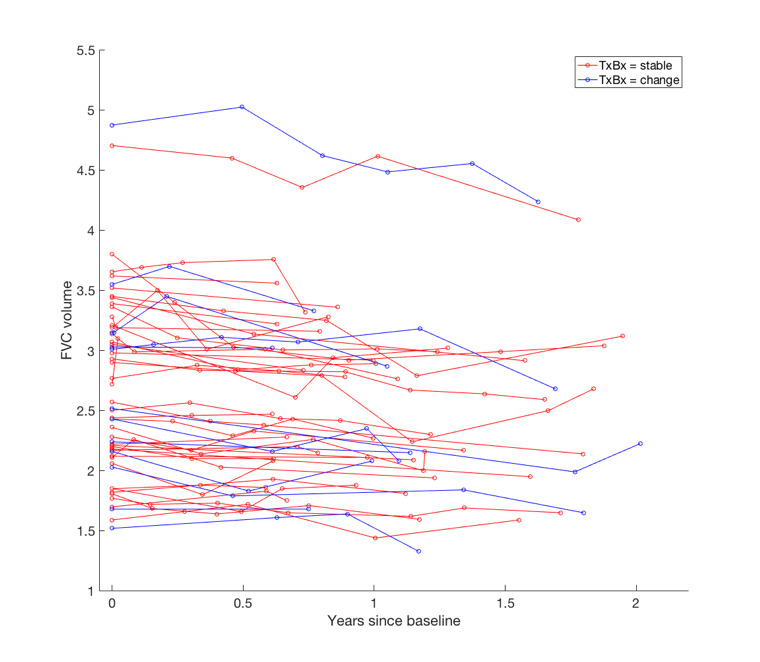
Figure 2.

Spaghetti plot demonstrating longitudinal change in FVC from the time of the baseline CT scan. Patients have been classified as having no change in traction bronchiectasis (red) and change in traction bronchiectasis (blue). The start and end FVC measurements considered in the longitudinal analyses were within 3 months of the respective CT scan dates. FVC, forced vital capacity; TxBx, traction bronchiectasis.
