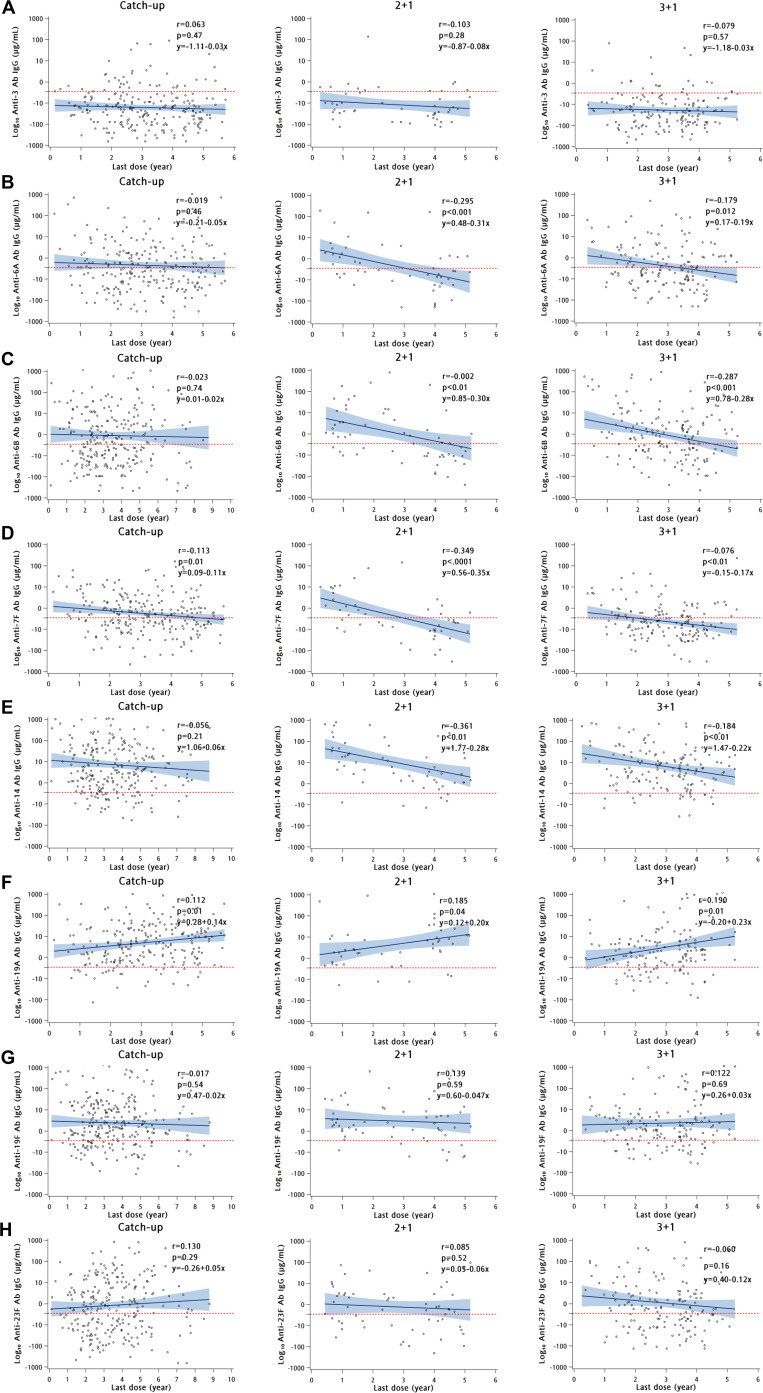
Figure 1.
Scatter plots showing linear regression lines and correlation coefficients between log IgG antibody titres with time (years) after PCV13 vaccination in children with catch-up (1–2 doses), 2+1 and 3+1 schedules. The individual titres are indicated by dots. Correlation coefficients were determined with the Pearson correlation test. r, Pearson correlation coefficient. P values <0.05 were regarded as statistically significant. Solid blue line is the regression line and the shaded blue region represents 95% CI of the regression line. Panels A–H refer to serotypes 3, 6A, 6B, 7F, 14, 19A, 19F and 23F, respectively. Time since last PCV13 dose ranged from 1 month to 9 years. Serotype 19A epidemic peaked in the years 2011 and 2012 in Taiwan; this time period corresponds to 4–6 years post last PCV13 dose. IgG, immunoglobulin G; PCV13, 13-valent pneumococcal conjugate vaccine.

