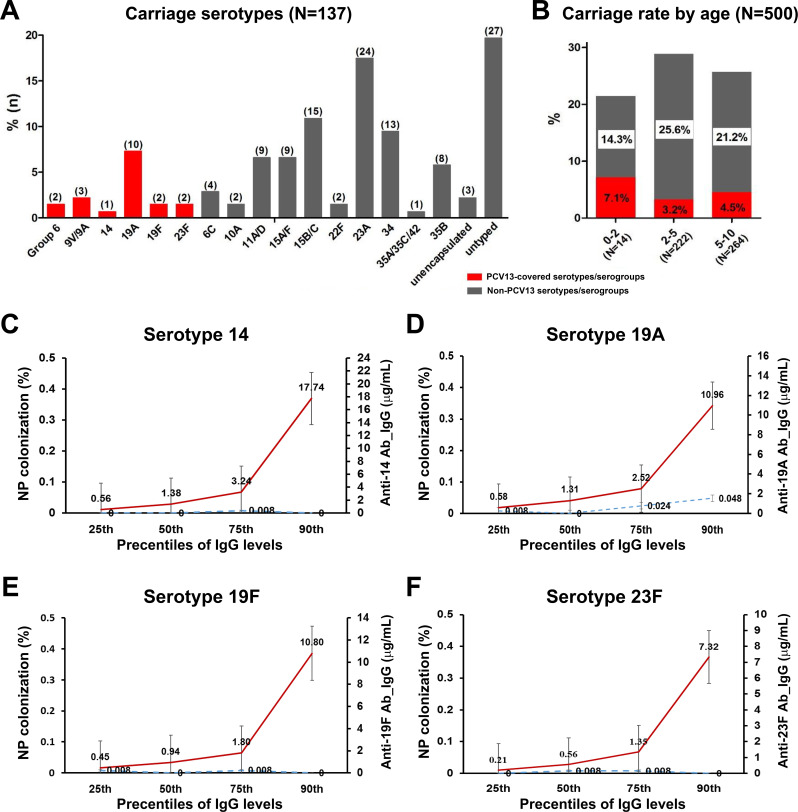
Figure 2.
Nasopharyngeal carriage of Streptococcus pneumoniae in children vaccinated with PCV13 in 2016–2017. Panel A displays serotype distribution of S. pneumoniae isolates. Number of isolates per serotype is in parentheses. PCV13 (red bars) and non-PCV13 serotypes (black bars). Panel B displays carriage rate of S. pneumoniae isolates of PCV13 serotypes (red bars) and non-PCV13 serotypes (black bars) by age group. The carriage rate was computed by dividing the number of positive samples by the total number of samples collected. Panels C–F display predicted point-prevalence carriage rates for serotypes 14, 19A, 19F and 23F corresponding to IgG concentration after PCV13 vaccination in 500 children. For each serotype, subjects were tested for IgG antibody levels and nasopharyngeal carriage of S. pneumoniae. The predicted changes in point-prevalence nasopharyngeal carriage rate corresponding to the antibody concentration threshold of ≥0.35 µg/mL and to selected percentiles of IgG concentration were calculated for the total population. Red line represents the IgG antibody levels in the secondary axis, and the blue dotted line represents the percent of nasopharyngeal carriage in the primary axis. IgG, immunoglobulin G; PCV13, 13-valent pneumococcal conjugate vaccine.

