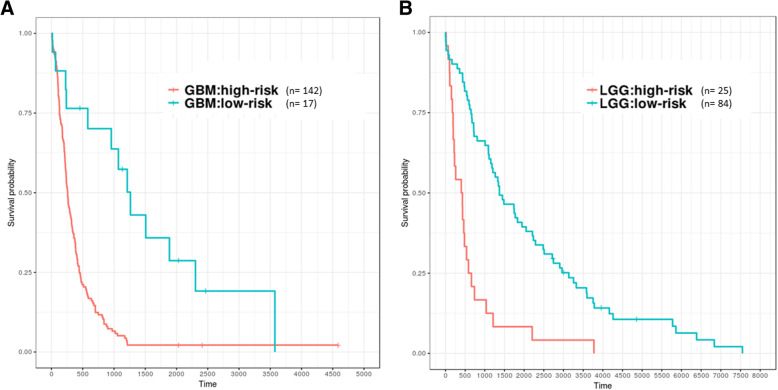
Fig. 7.
Patients with GBM and LGG were divided into high- and low-risk groups identified based on ten genes (GEO samples). X-axis: patients’ OS duration (days); Y-axis: patients’ survival rate. a GBM, log rank test between high-risk (n = 142) and low-risk (n = 17) groups was significant difference (p < 0.01). b LGG, log rank test between high-risk (n = 25) and low-risk (n = 84) groups was significant difference (p < 0.01)

