
Fig. 2.
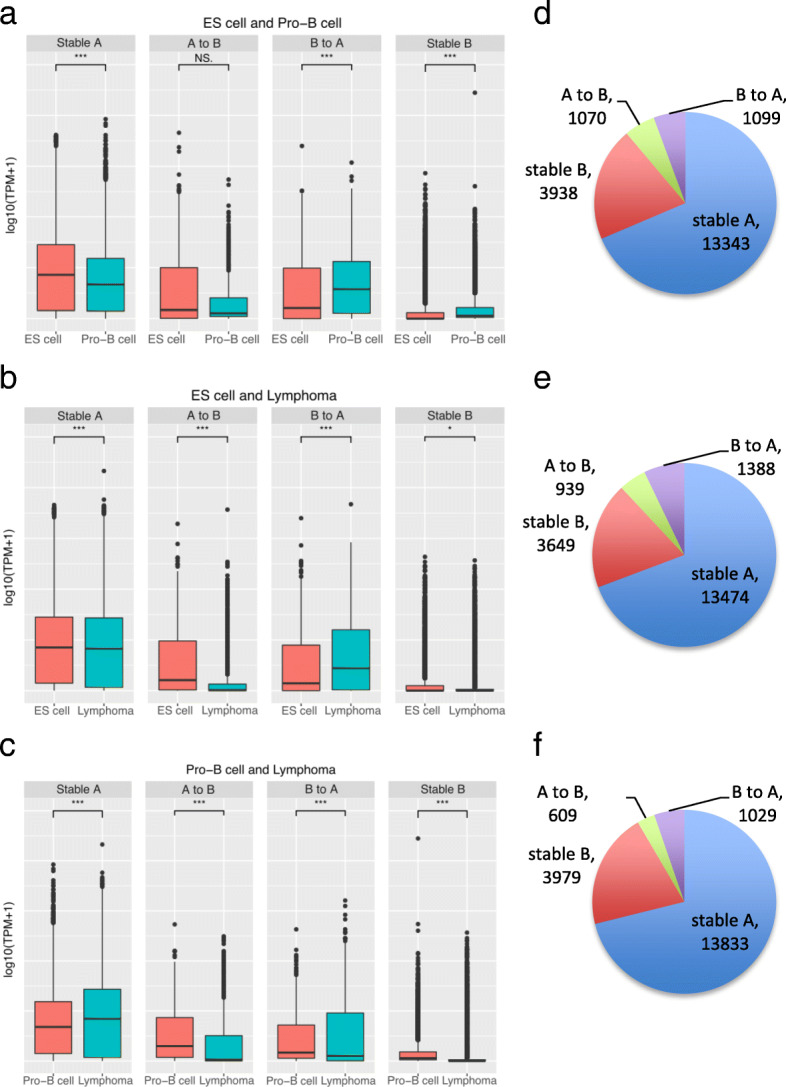
Profile of gene expression in compartment reorganization comparing ES cells, pro-B cells and lymphoma. Values represent the expression level of genes identified in the respective regions (log10 of TPM values + 1). The panels (a-c) show the tendency of genes having higher RNA abundance when located at active A compartment rather than inactive B compartment. Although B compartment is extensively reported as inactive compartment, it still contains genes with higher levels of RNA molecules. a ES cells and pro-B cells comparison. b ES cells and lymphoma comparison. c Pro-B cells and lymphoma comparison. The plots (d-f) represent the ratio of each comparison with the number of genes in each group