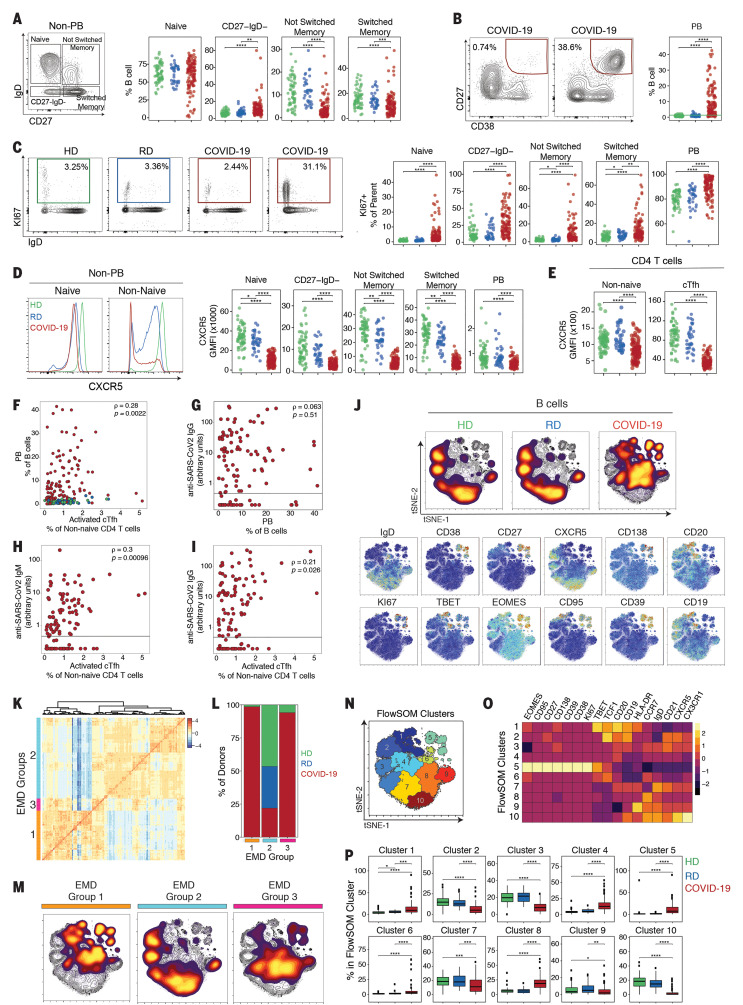
Fig. 4. Deep profiling of COVID-19 patient B cell populations reveals robust PB populations and other B cell alterations.
(A) Gating strategy and frequencies of non-PB B cell subsets. (B) Representative flow cytometry plots and frequencies of PBs. The green line in the right panel denotes the upper decile of HDs. (C) Representative flow cytometry plots and frequencies of KI67+ B cells. (D) (Left) Representative histograms of CXCR5 expression; (right) CXCR5 geometric MFI (GMFI) of B cell subsets. (E) CXCR5 GMFI of non-naïve CD4 T cells and cTFH cells. (F) Spearman correlation between PBs and activated cTFH cells. (G) Spearman correlation between PBs and anti–SARS-CoV-2 IgG. (H and I) Spearman correlation between activated cTFH cells and anti–SARS-CoV-2 (H) IgM and (I) IgG. (J) (Top) Global viSNE projection of B cells for all participants pooled, with B cell populations of each cohort concatenated and overlaid. (Bottom) viSNE projections of expression of the indicated proteins. (K) Hierarchical clustering of EMD using Pearson correlation, calculated pairwise for B cell populations for all participants (row-scaled z-scores). (L) Percentage of cohort in each EMD group. (M) Global viSNE projection of B cells for all participants pooled, with EMD groups 1 to 3 concatenated and overlaid. (N) B cell clusters identified by FlowSOM clustering. (O) MFI as indicated (column-scaled z-scores). (P) Percentage of B cells from each cohort in each FlowSOM cluster. Boxes represent IQRs. (A to F and P) Dots represent individual HDs (green), RDs (blue), or COVID-19 (red) participants. (A to E and P) Significance was determined by unpaired Wilcoxon test with BH correction: *P < 0.05, **P < 0.01, ***P < 0.001, and ****P < 0.0001. (G to I) The black horizontal line represents the positive threshold.

