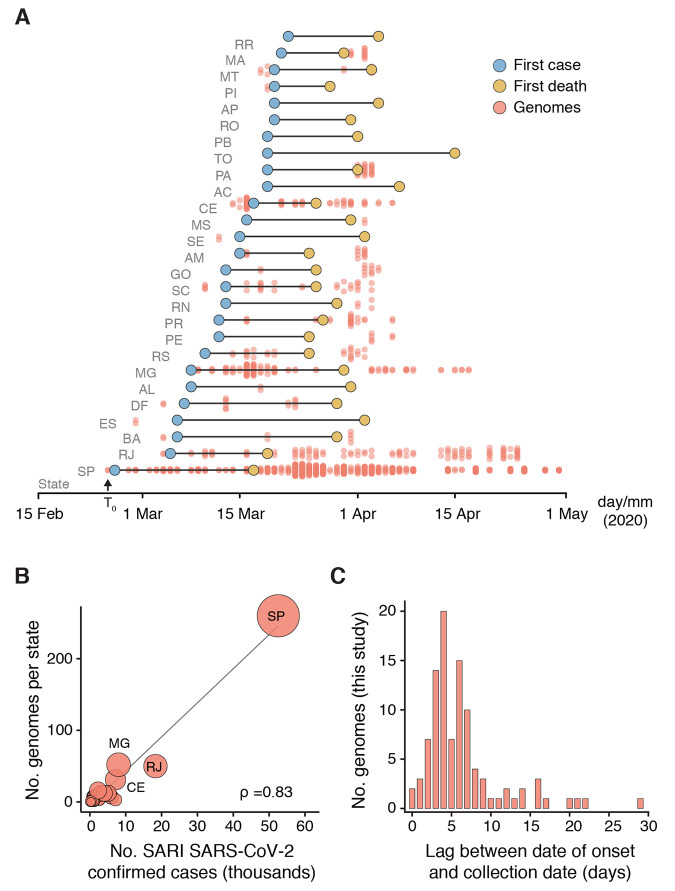
Fig. 2. Spatially-representative genomic sampling.
(A) Dumbbell plot showing the time intervals between date of collection of sampled genomes, notification of first cases and first deaths in each state. Red lines indicate the lag between the date of collection of first genome sequence and first reported case. The key for the 2-letter ISO 3166-1 codes for Brazilian federal units (or states) are provided in Supplementary Information. (B) Spearman’s rank (ρ) correlation between the number of SARI SARS-CoV-2 confirmed and SARI cases with unknown aetiology against number of sequences for each of the 21 Brazilian states included in this study (see also fig. S4). Circle sizes are proportional to the number of sequences for each federal unit. (C) Interval between the date of symptom onset and date of sample collection for the sequences generated in this study.

