Fig. 4.
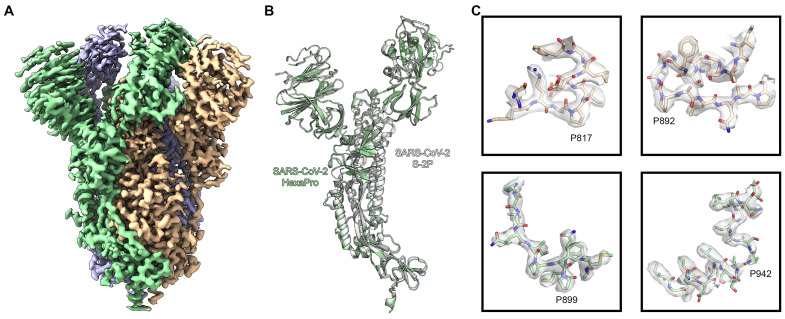
High-resolution cryo-EM structure of HexaPro. (A) EM density map of trimeric HexaPro. Each protomer is shown in a different color; the protomer depicted in wheat adopts the RBD-up conformation. (B) Alignment of an RBD-down protomer from HexaPro (green ribbon) with an RBD-down protomer from S-2P (white ribbon, PDB ID: 6VSB). (C) Zoomed view of the four proline substitutions unique to HexaPro. The EM density map is shown as a transparent surface and individual atoms are shown as sticks. Nitrogen atoms are colored blue and oxygen atoms are colored red.

