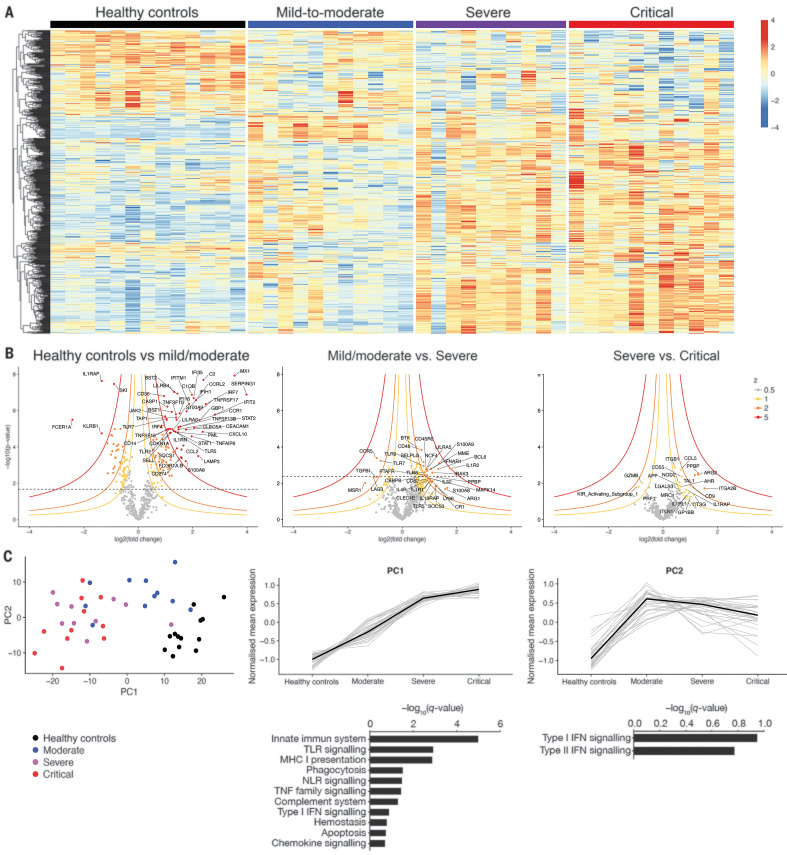
Fig. 2. Immunological transcriptional signature of SARS-CoV-2 infection.
RNA extracted from patient whole blood and RNA counts of 574 genes were determined by means of direct probe hybridization, using the Nanostring nCounter Human Immunology_v2 kit. (A) Heatmap representation of all genes, ordered by hierarchical clustering. Healthy controls (n = 13 patients), mild to moderate (n = 11 patients), severe (n = 10 patients), and critical (n = 11 patients). Up-regulated genes are shown in red, and down-regulated genes are shown in blue. (B) Volcano plots depicting log10 (P value) and log2 (fold change), as well as z value for each group comparison (supplementary materials, materials and methods). Gene expression comparisons allowed the identification of significantly differentially expressed genes between severity grades (heathy controls versus mild to moderate, 216 genes; mild to moderate versus severe, 43 genes; severe versus critical, 0 genes). (C) (Left) PCA of the transcriptional data. (Middle and right) Kinetic plots showing mean normalized values for each gene and severity grade, where each gray line corresponds to one gene. Median values over genes for each severity grade are plotted in black. Gene set enrichment analysis of pathways enriched in PC1 and PC2 are depicted under corresponding kinetic plot.

