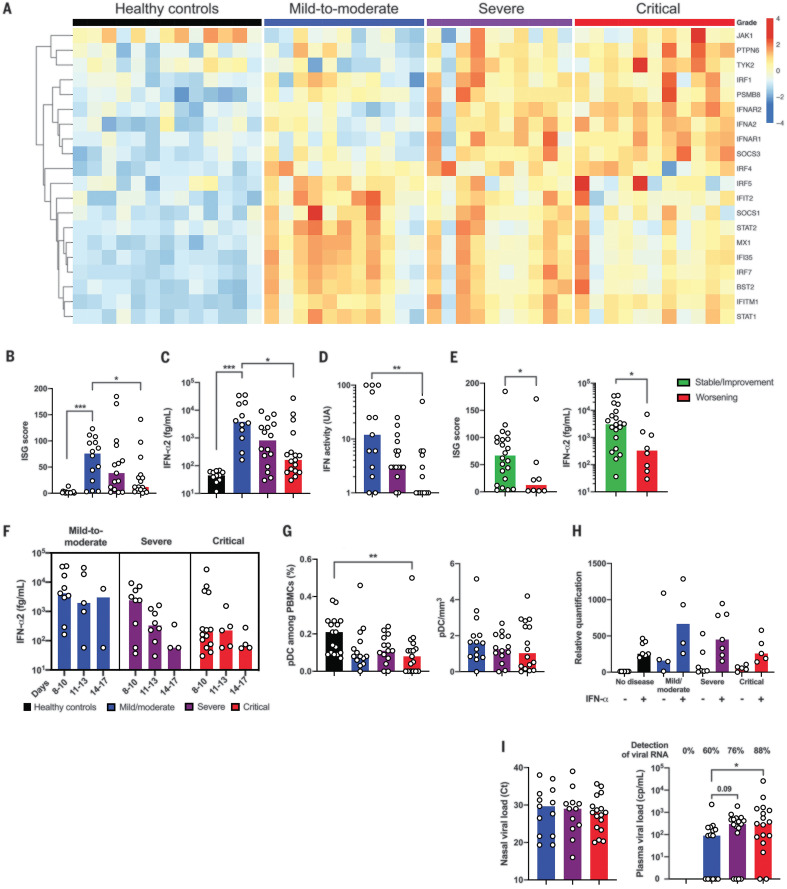
Fig. 3. Impaired type I IFN response in patients with severe SARS-CoV-2 infection.
(A) Heatmap showing expression of type I IFN-related genes by using the reverse transcription- and PCR-free Nanostring nCounter technology in patients with mild-to-moderate (n = 11), severe (n = 10), and critical (n = 11) SARS-CoV2 infection, and healthy controls (n = 13). Up-regulated genes are shown in red, and down-regulated genes are shown in blue. (B) ISG score based on expression of six genes (IFI44L, IFI27, RSAD2, SIGLEC1, IFIT1, and IS15) measured with quantitative RT-PCR in whole blood cells from mild to moderate (n = 14), severe (n = 15), and critical (n = 17) patients and healthy controls (n = 18). (C) IFN-α2 (fg/ml) concentration evaluated by use of Simoa and (D) IFN activity in plasma according to clinical severity. (E) Mild to moderate (n = 14) and severe patients (n = 16) were separated in two groups depending on the clinical outcome, namely critical worsening requiring mechanical ventilation (to denote severe status). (Left) ISG score and (right) IFN-α2 plasma concentration are shown. (F) Time-dependent IFN-α2 concentrations are shown according to severity group. (G) Quantification of plasmacytoid dendritic cells (pDCs) as a percentage of PBMCs and as cells/milliliter according to severity group. (H) ISG score before and after stimulation of whole blood cells by IFN-α (103UI/ml for 3 hours). (I) Viral loads in nasal swabs estimated by means of RT-PCR and expressed in cycle threshold (Ct) and blood viral load evaluated by means of digital PCR. In (B) and (E), ISG score results represent the fold-increased expression compared with the mean of unstimulated controls and are normalized to GAPDH (glyceraldehyde phosphate dehydrogenase). In (B) to (I), data indicate median. Each dot represents a single patient. P values were determined with the Kruskal-Wallis test, followed by Dunn’s post-test for multiple group comparisons and the Mann-Whitney test for two group comparisons with median reported; *P < 0.05; **P < 0.01; ***P < 0.001.

