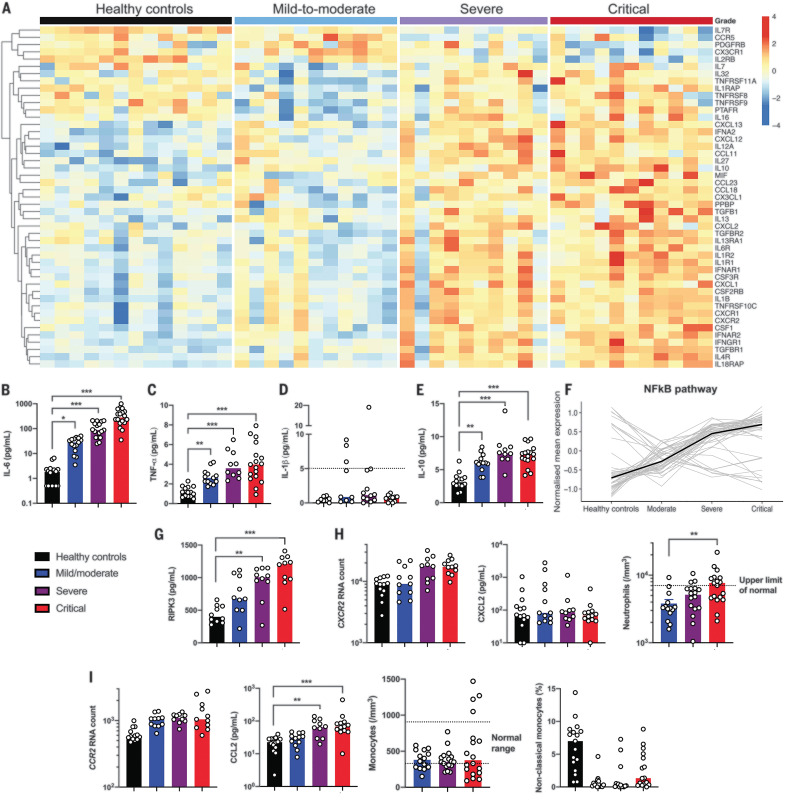
Fig. 4. Immune profiling in patients with severe and critical SARS-CoV-2 infection.
(A) Heatmap showing the expression of cytokines and chemokines that are significantly different in severe and critical patients, ordered by hierarchical clustering. Included are healthy controls (n = 13) and mild to moderate (n = 11), severe (n = 10), and critical (n = 11) patients. Up-regulated genes are shown in red, and down-regulated genes are shown in blue. (B) IL-6, (C) TNF-α, (D) IL-1β, and (E) IL-10 proteins were quantified in the plasma of patients by using Simoa technology or a clinical-grade ELISA assay (supplementary materials, materials and methods). Each group includes n = 10 to 18 patients. The dashed line indicates the limit of detection (LOD). (F) Kinetic plots showing mean normalized value for each gene and severity grade. Each gray line corresponds to one gene belonging to the NF-κB pathway. Median values over genes for each severity grade are plotted in black. (G) Plasma quantification of RIPK-3. Each group included n = 10 patients. (H) Absolute RNA count for (left) CXCR2, (middle) CXCL2 protein plasma concentration measured with Luminex technology, and (right) blood neutrophil count depending on severity group. The dashed line indicates the upper normal limit. Each group includes n = 10 to 13 patients. (I) Absolute RNA count for (left) CCR2; (middle left) CCL2 protein plasma concentration measured by Luminex technology; and (middle right) blood monocyte count depending on severity group. The dashed lines depict the normal range. (Right) The percentage of nonclassical monocytes, depending on severity grade. Each group shows n = 10 to 18 patients. RNA data are extracted from the Nanostring nCounter analysis (supplementary materials, materials and methods). In (B) to (I), data indicate median. Each dot represents a single patient. P values were determined with the Kruskal-Wallis test, followed by Dunn’s post-test for multiple group comparisons with median reported; *P < 0.05; **P < 0.01; ***P < 0.001.

