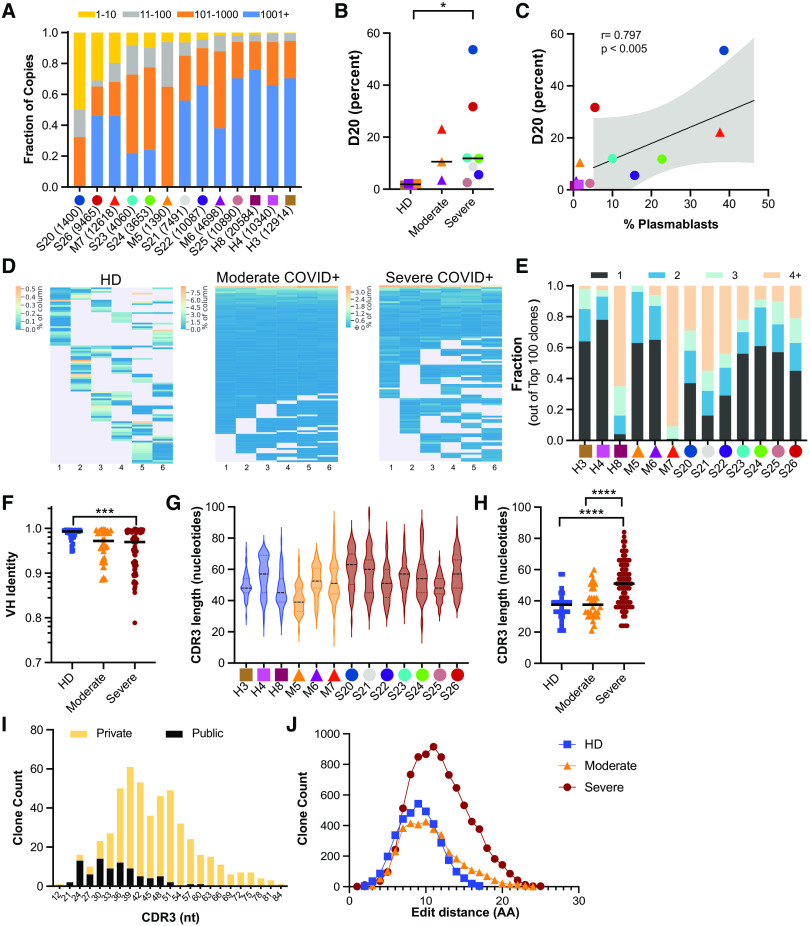
Fig. 3.
Abundant antibody heavy chain sequences from severe COVID-19+ individuals have long, diverse CDR3 sequences and higher levels of somatic hypermutation. A) Clone size distribution by sequence copies. For each donor, the fraction of total sequence copies occupied by the top ten clones (yellow), clones 11-100 (grey), 101-1000 (orange) and over 1000 (blue) are shown. Total donor level clone counts are given in parentheses. B) Percentage of sequence copies occupied by the top twenty ranked clones (D20) shown for HD (n=3) and COVID-19+ individuals with moderate (n=3) and severe disease (n=7). C) Spearman correlation between the D20 value and the percentage of plasmablasts within the total B cell population. D) Examples of the overlap of top 100 copy rearrangements that overlap in at least two sequencing libraries in HD (H4), a moderate COVID-19+ (M7) and a severe COVID-19+ individual (S21). Each horizontal string is a rearrangement and each column is an independently amplified sequencing library (see Materials and Methods). Lines are heat mapped by the copy number fraction for a given replicate library. E) Clone size estimation based on sampling (presence/absence in sequence libraries). Shown are the fractions of the top 100 clones that are found in 4 or more sequencing libraries, 3 libraries, 2 libraries and 1 library. All donors had six sequencing libraries, except for M5 (four libraries). F) Fractional identity to the nearest germline VH gene sequence (1.0 = unmutated) in the top 10 copy number clones of each donor. Each symbol is a clone. G) CDR3 length distributions of the top 50 productive rearrangements in each donor. H) CDR3 lengths of the top 10 copy number clones (symbols), stratified by condition. I) CDR3 length distribution of top 50 clones in COVID-19+ donors based on whether they are found in the Adaptive database (public) or not (private). J) Distribution of CDR3 amino acid (AA) edit distances of the top 50 copy clones (productive) per donor. Clone pair counts for each edit distance are averaged across all the donors in each disease category. Differences between groups were calculated using Mann-Whitney rank-sum test. **** p<0.0001, ***p<0.001, *p<0.05.

