
Fig. 1. Single cell transcriptomes of PBMCs from COVID-19 and influenza patients.
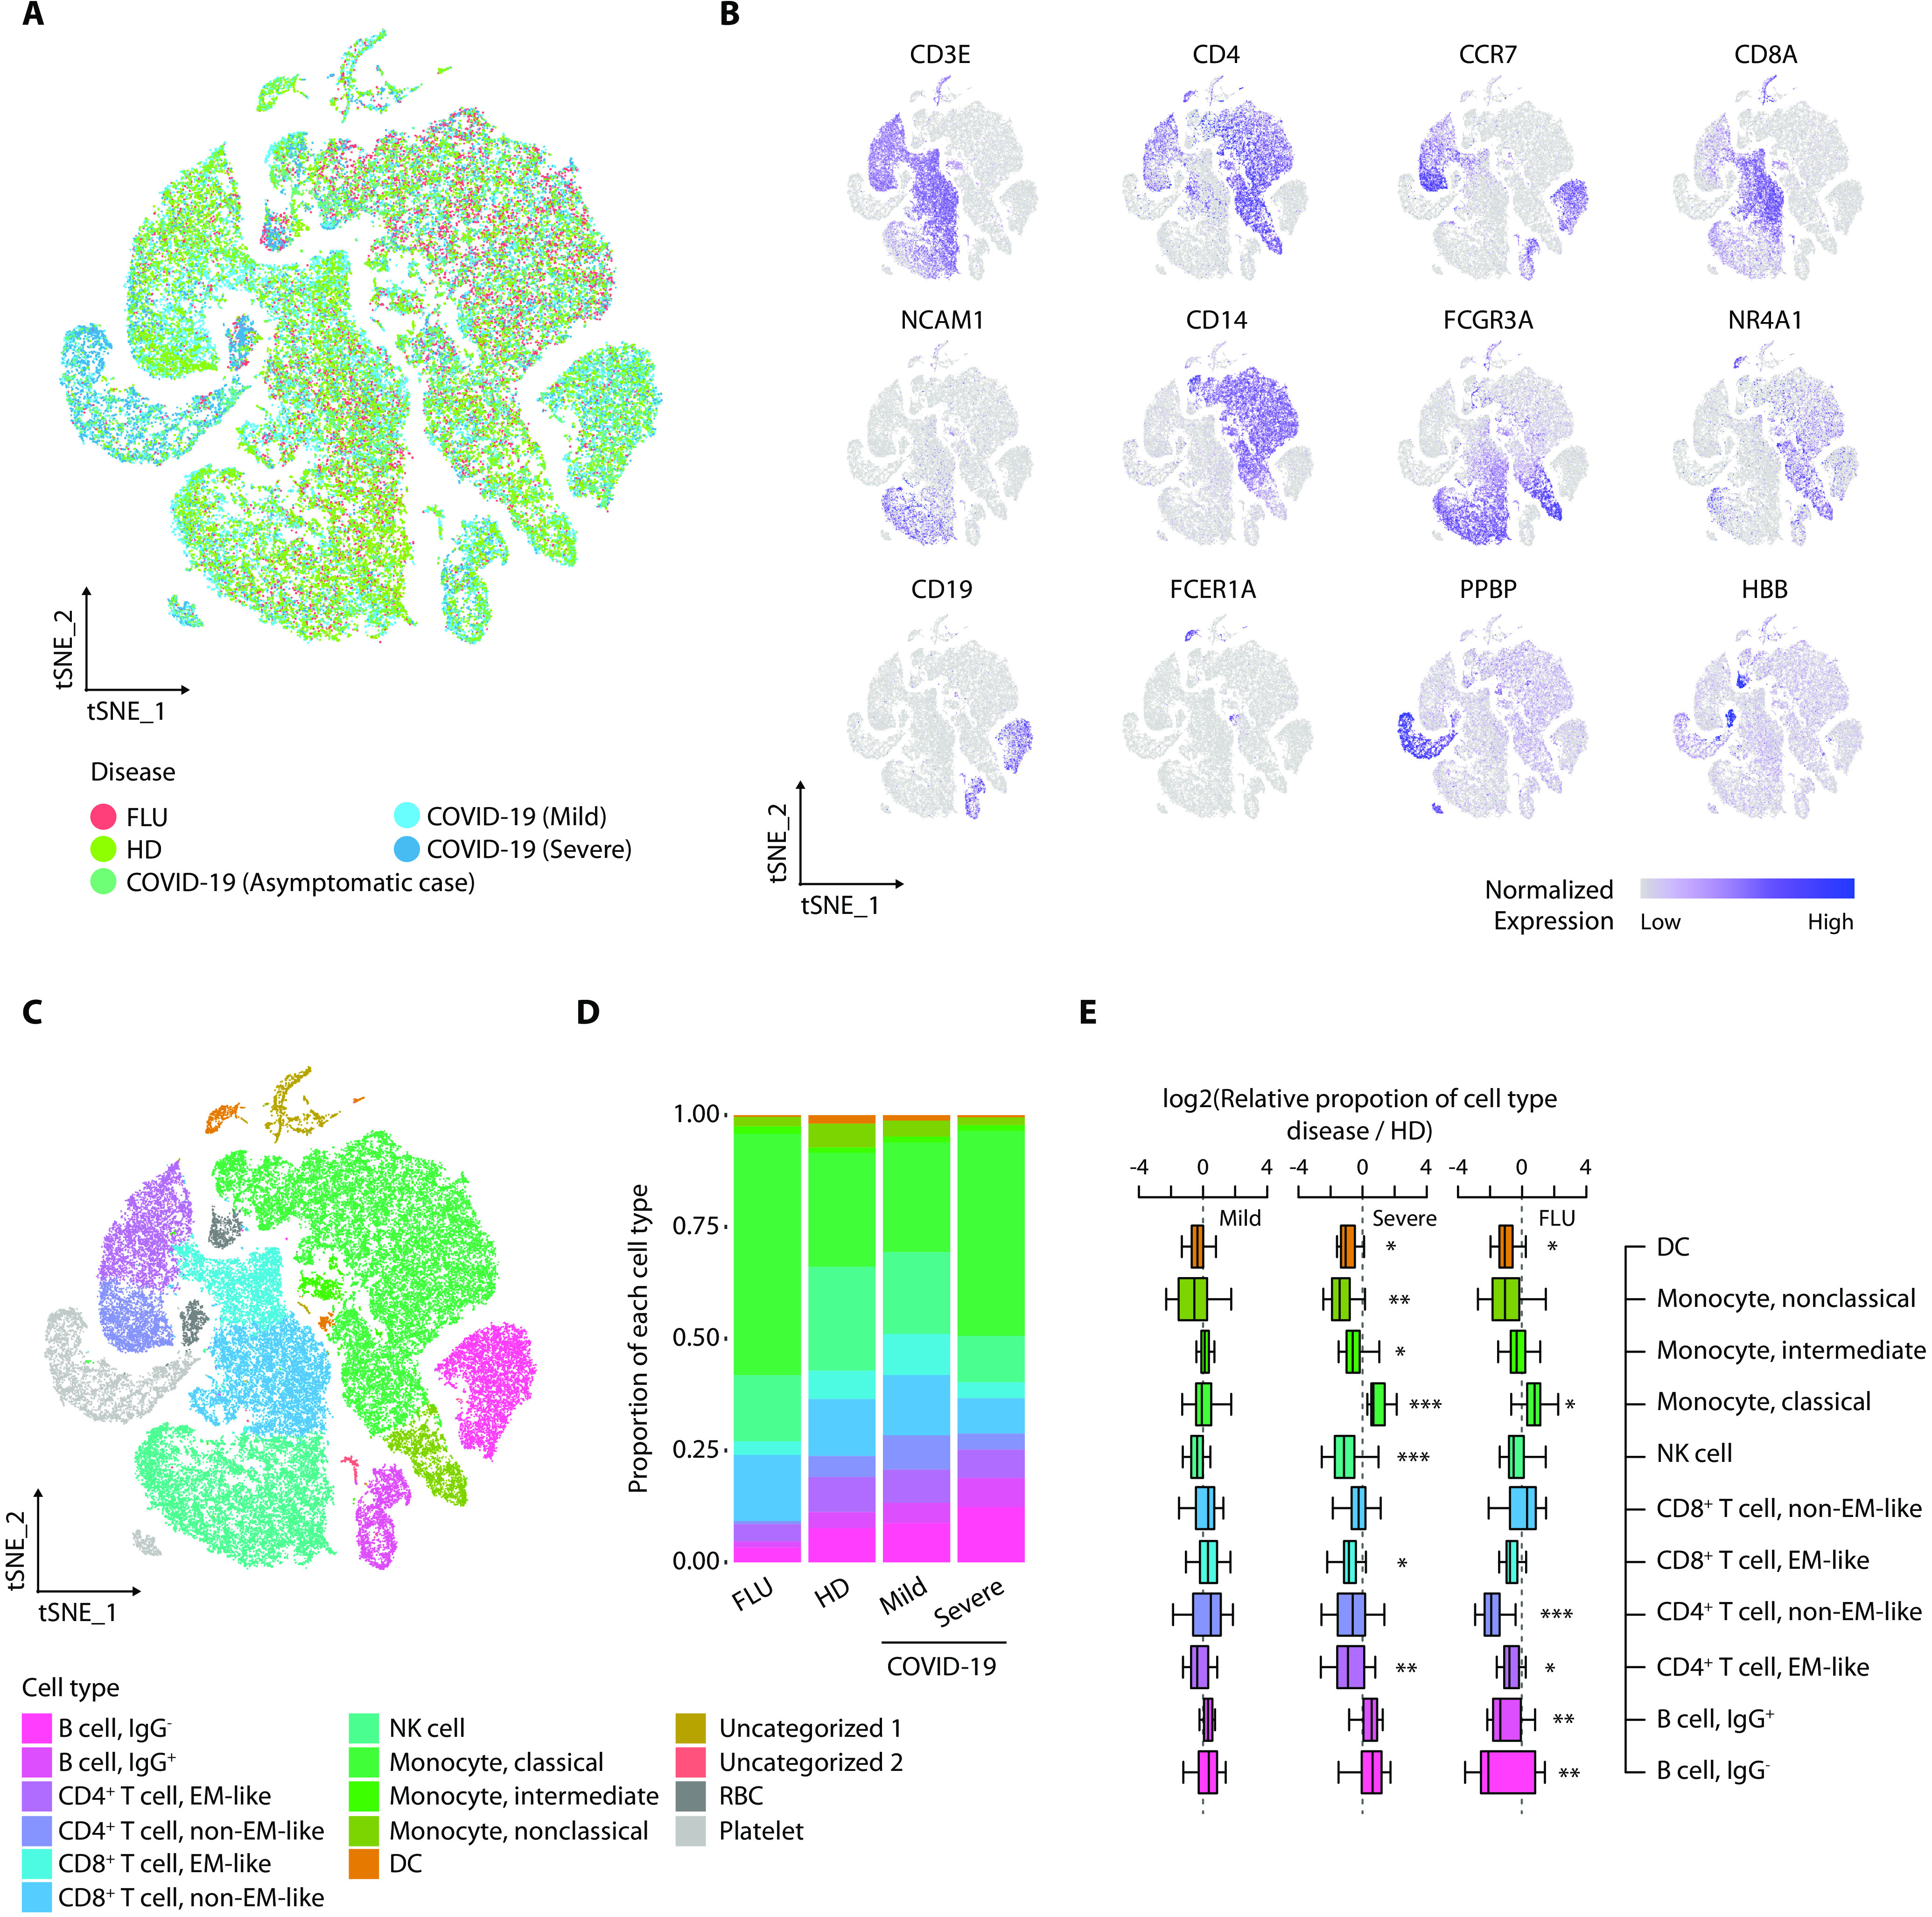
(A) tSNE projections of 59,572 PBMCs from healthy donors (HDs) (4 samples, 17,590 cells), severe influenza (FLU) patients (5 samples, 10,519 cells), COVID-19 patients (asymptomatic: 1 sample, 4,425 cells; mild COVID-19: 4 samples, 16,742 cells; severe COVID-19: 6 samples, 10,296 cells) colored by group information. (B) Normalized expression of known marker genes on a tSNE plot. (C) tSNE plot colored by annotated cell types. EM: effector memory, NK cell: natural killer cell, DC: dendritic cell, RBC: red blood cell. (D) Proportion of cell types in each group excluding ‘Uncategorized 1’, ‘Uncategorized 2’, ‘RBC’, and ‘Platelet’. The colors indicate cell type information. (E) Boxplots showing the fold enrichment in cell type proportions from mild COVID-19 (n=4), severe COVID-19 (n=6), and FLU (n=5) patients compared to the HD group (mild COVID-19 vs. HD: n=16, severe COVID-19 vs. HD: n=24, FLU vs. HD: n=20). For the boxplots, the box represents the interquartile range (IQR) and the whiskers correspond to the highest and lowest points within 1.5 × IQR. ‘Uncategorized 1’ (relatively high UMIs per cells and presence of multiple marker genes), ‘Uncategorized 2’ (B cell-like and high expression of ribosomal protein genes), ‘RBC’, and ‘Platelet’ were excluded. Two-sided Kolmogorov–Smirnov (KS) tests were conducted for each cell type between the disease and HD group. *p<0.05, **p<0.01, and ***p<0.001.