
Figure 2.
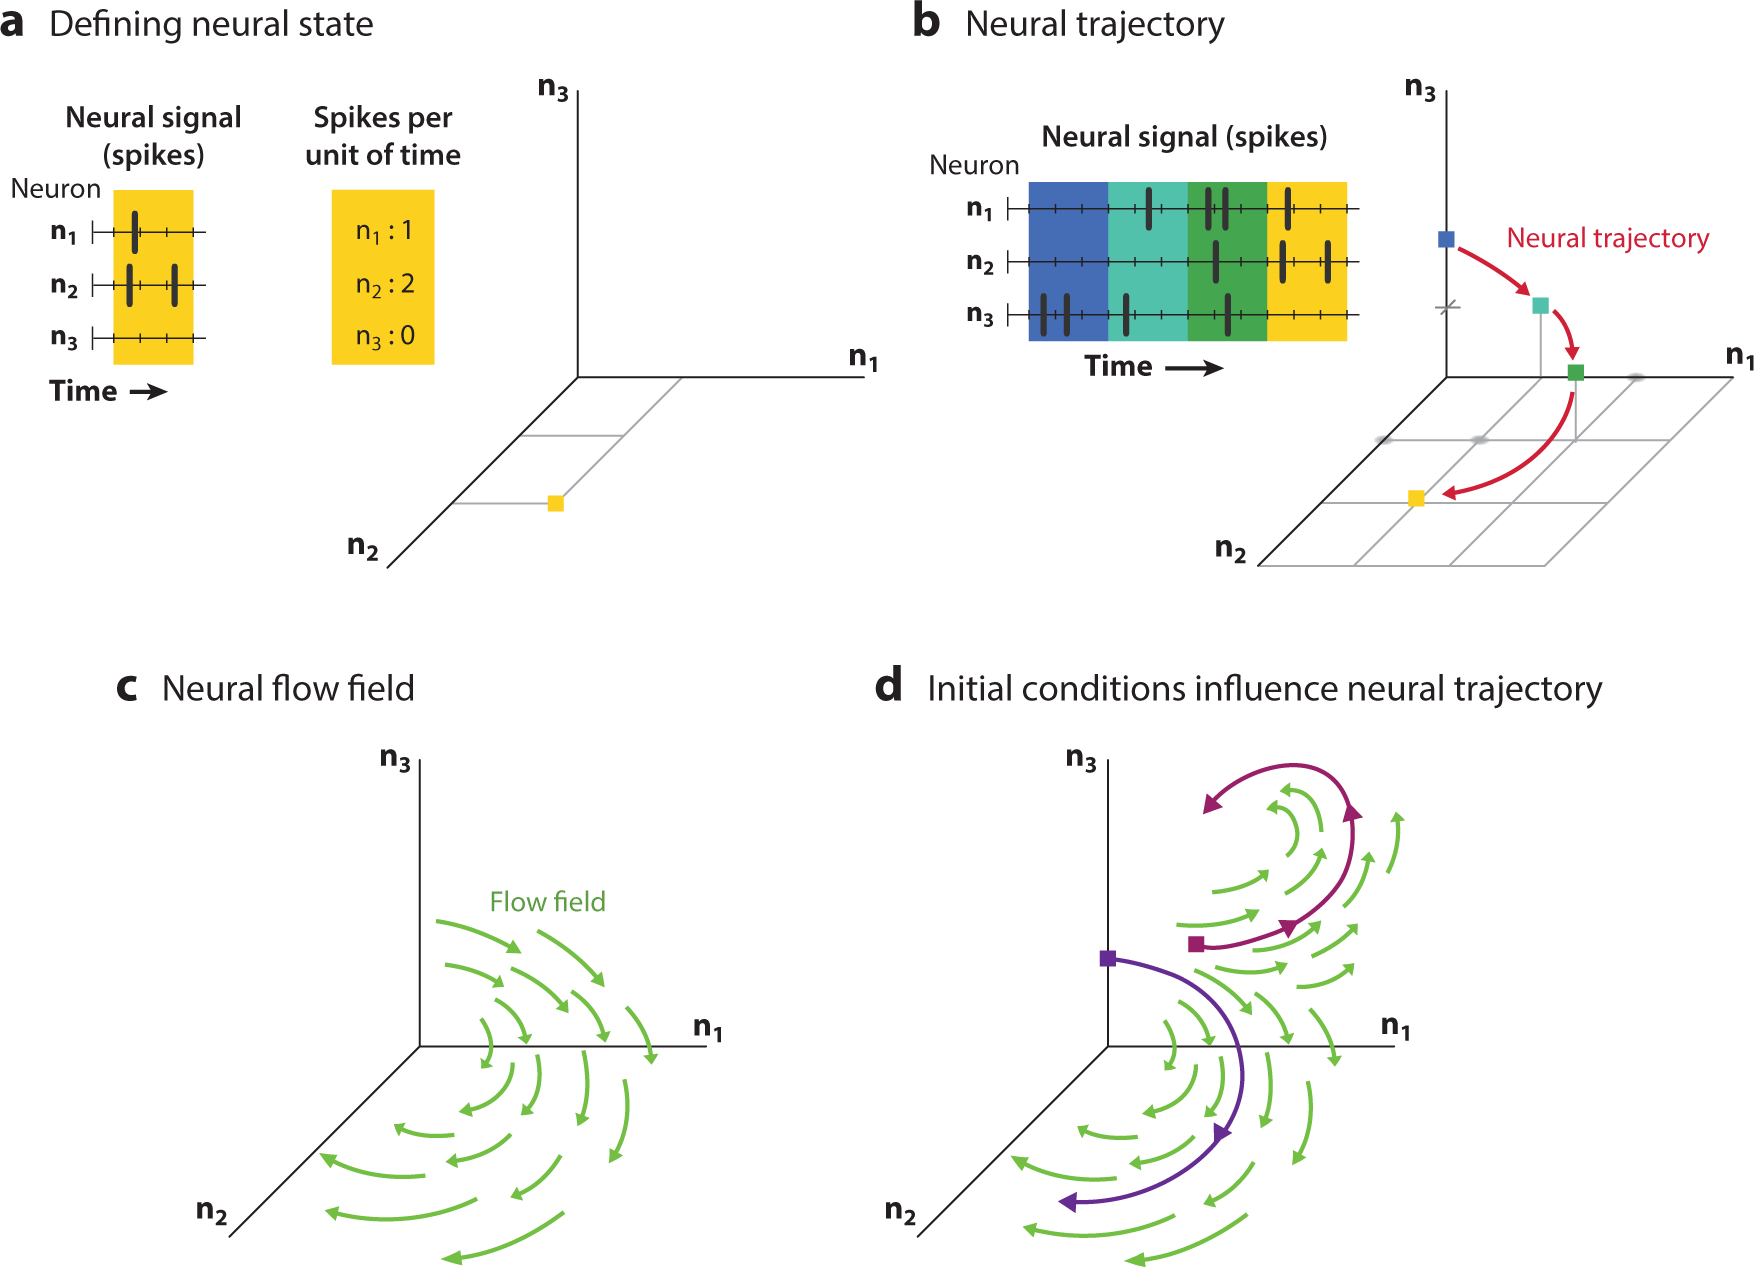
Neural population state and neural dynamics. (a) Three neurons spike through time (left), and these spikes are binned and counted (center). These spike counts are plotted in a three-dimensional state space (right) representing the three neurons (n1, n2, n3), with a yellow square representing the state of the neural system at that time point. (b) Continued binning of spikes through time (left) leads to a neural population state that progresses in a sequence (blue, cyan, green, yellow), which is plotted in the neural state space plot (right) to yield an intuitive picture of the neural population dynamics. (c) The neural population dynamics can be represented by a flow field (green arrows) that describes how the neural population state evolves through time. (d) Two different neural trajectories (magenta and purple curves) can result from following the neural population dynamics from different initial conditions (magenta and purple squares).