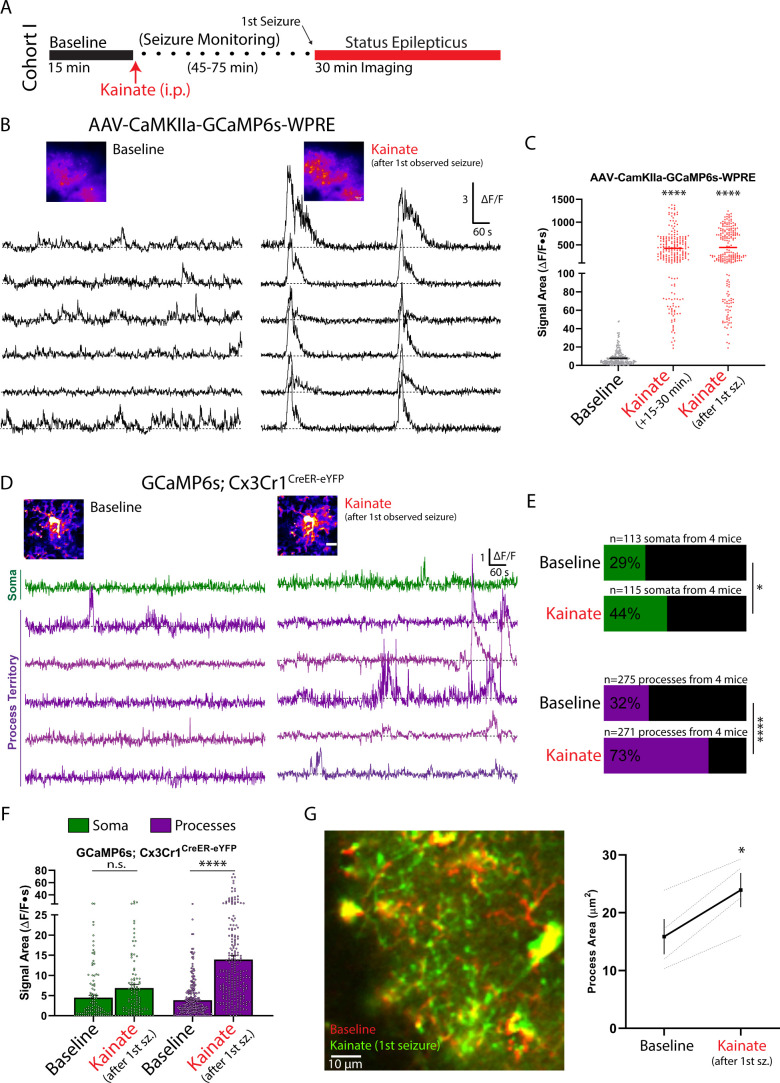
Figure 4. Increased microglial process calcium activity immediately following the observation of kainate-induced seizures.
(A) Outline of the experimental timeline. Mice experienced a first seizure 45–75 min after kainate injection, which marked the beginning of imaging during periods labelled as ‘kainate.’ (B–C) CaMKIIa excitatory neuronal calcium activity (AAV.CaMKIIa.GCaMP6s.WPRE transfection) in the somatosensory cortex before and after kainate administration. (B) Representative ∆F/F traces at baseline, and after the first observed generalized seizure (45–75 min after kainate). (C) Signal areas derived from CaMKIIa somata in layer II/III (1-Way ANOVA with Dunnett’s post-hoc comparison to baseline). (D-G) Microglial calcium activity (GCaMP6s;Cx3Cr1CreER-eYFP) in the awake animal at baseline and after the first kainate-induced generalized seizure. (D) Representative ∆F/F traces from a microglial cell using threshold-based ROI detection. (E) The percentage of active microdomains under each condition (Fisher’s exact test). (F) Summary of calcium signal area values at baseline and after the first generalized seizure (two-way ANOVA with post-hoc comparison between kainate and baseline), using the threshold-segmentation approach for quantification. (G) Two-color, average intensity images of microglial morphology at baseline and after kainate-induced seizures, suggesting overall process extension. Changes in process area are quantified between conditions (paired t-test). Scale bars: 50 µm (B), 10 µm (D). Grouped data represent the mean ± SEM; dots represent individual neuronal somata (C) or individual microdomains (F); dashed lines represent individual animals (G). N = 3 mice for neuronal calcium studies (B, C), N = 4 mice for microglial calcium studies (D–F); the number of microdomains surveyed is provided in (D). *p<0.05, ****p<0.0001.

