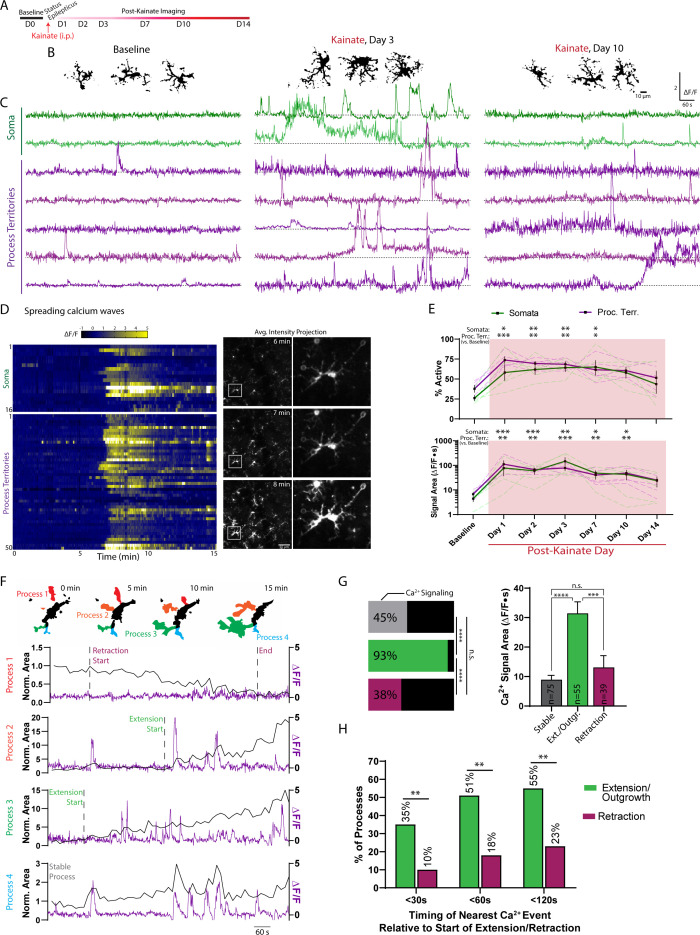
Figure 5. Kainate administration leads to longitudinal modulation of microglial calcium signaling.
(A) Timeline of experiment. (B) Representative images of microglia morphology at baseline and following kainate status epilepticus. See also: Figure 5—figure supplement 1. (C) ∆F/F traces of microglial somatic and process calcium activity, using the threshold-based approach to detect microglial process territories. (D) Heat map of a microglial spreading calcium wave one day after kainate status epilepticus. Each row represents activity from a soma or one of 50 threshold-segmented process territories surveyed across this single field of view and animal. See also: Figure 5—Video 1. Corresponding images of microglia across the whole field of view during the peak of wave activity, with a highlighted cell magnified. (E) Microdomains active and their signal areas (two-way ANOVA with Dunnett’s post-hoc vs. baseline). (F) Representative changes in microglial process area (black line; 15 s avg. intensity images) correlated with ∆F/F calcium activity (purple line). Changes in process area were used to denote the start and end of retraction or extension. See also: Figure 5—figure supplement 2. (G) Based upon these criteria, extending processes were more likely to have associated calcium activity than processes undergoing retraction or remaining stable (horizontal bars, Fisher’s exact test). Additionally, the calcium signals observed in extending processes were larger in magnitude (one-way ANOVA with Tukey’s post-hoc test; the number of sampled regions fitting each criterion is provided in the bar; mean ± SEM). See also: Figure 5—Video 2. (H) The percentage of processes exhibiting a calcium transient within a certain time window relative to the start of process extension or retraction. This analysis considers the closest temporally aligned calcium event preceding and/or following the start of extension/retraction (see methods for further details; survey of 55 extending processes and 39 retracting processes; Fisher’s exact test). Scale bar: 50 µm (D). N = 5 GCaMP6s;Cx3Cr1CreER-eYFP mice. Grouped data represent mean ± SEM; dashed lines represent individual animals (E). *p<0.05, **p<0.01, ***p<0.001.


