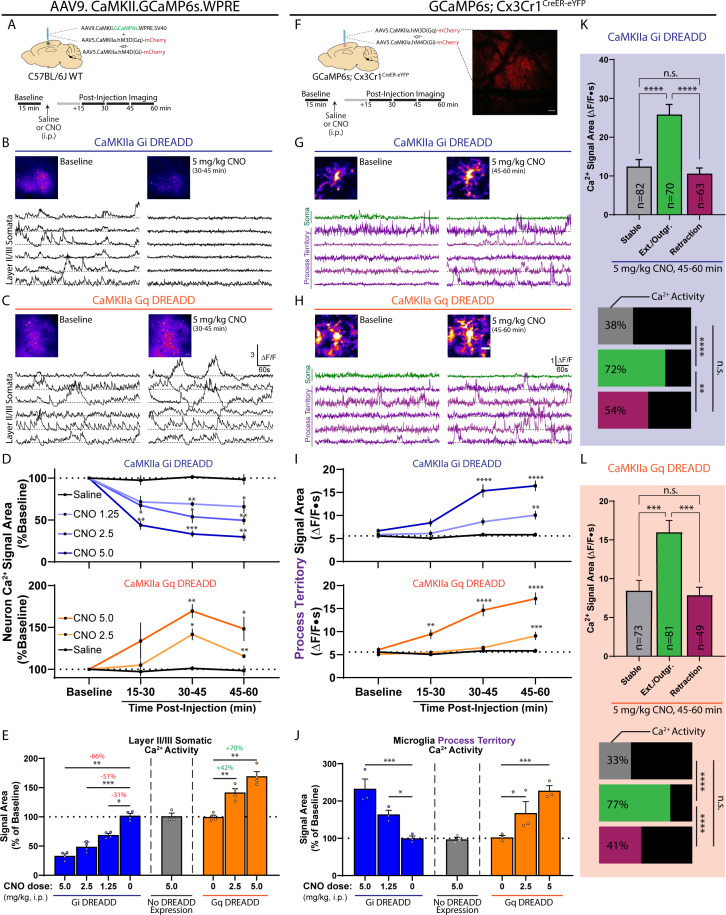
Figure 6. DREADD-based modulation of excitatory neuronal activity is sufficient to induce microglial calcium signaling.
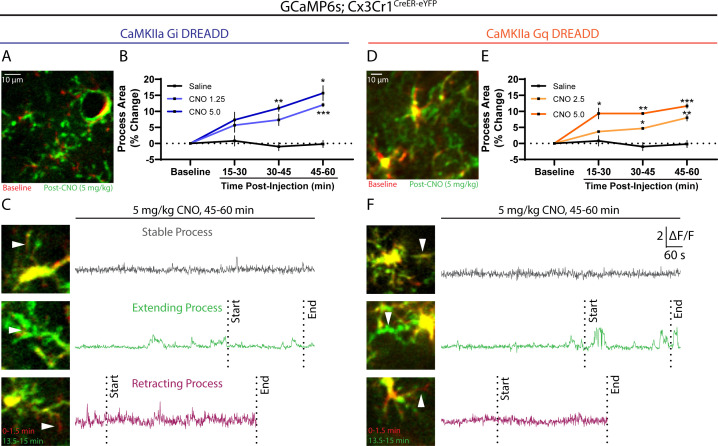
(A) AAVs injected into the somatosensory cortex of WT mice in order to study DREADD-based changes in neuronal calcium activity (top). Experiment outline (bottom). (B–C) Representative ∆F/F traces of layer 2/3 CaMKIIa neuronal calcium activity at baseline and after CNO injection in the Gi (B) and Gq (C) systems. (D) Saline or CNO dose-dependent effects on neuronal calcium activity in the Gi and Gq systems over 15 min imaging periods (one-way ANOVA with Dunnett’s post-hoc comparison to saline). (E) Summary of DREADD-based effects on neuronal calcium activity (at the time of peak effect: 30–45 min post injection; two-way ANOVA with Dunnett’s post-hoc comparison to baseline). (F) Method to study DREADD-based changes in neuronal activity on microglial calcium signaling. mCherry expression served as a positive control for successful DREADD transfection. (G–H) Representative ∆F/F traces of microglial soma and process territory calcium activity at baseline and after CNO injection in the Gi (G) and Gq (H) systems. The threshold-based ROI approach was used to detect process regions. (I) Microglial process territory calcium activity in the Gi and Gq systems over 15 min imaging periods (one-way ANOVA with Dunnett’s post-hoc vs. saline). (J) Summary of DREADD-based effects on microglial process territory calcium activity (at the time of peak effect: 45–60 min post injection; two-way ANOVA with Dunnett’s post-hoc comparison to baseline). (K) The mean ± SEM calcium signal area is plotted for microglial process territories that remained stable, demonstrated new process outgrowth, or exhibited retraction 45–60 min after 5 mg/kg CNO injection in the Gi DREADD system (one-way ANOVA with Tukey’s post-hoc test; process sample size given in the bar). The percentage of processes exhibiting calcium activity by motility/structural characteristic is displayed in the horizontal bars (Fisher’s exact test). (L) The same analyses as performed in (K) for the Gq DREADD system (see Figure 6—figure supplement 1 for more detail). Scale bars: 50 µm (B, C, and F), 10 µm (G-H). (A-E) N = 8 WT mice, N = 4/8 receiving AAV-CaMKIIa-hM4D(Gi) and N = 4/8 receiving AAV-CaMKIIa-hM3D(Gq). (F-J) N = 6 GCaMP6s;Cx3Cr1CreER-eYFP mice, half receiving Gq or Gi DREADD. Grouped data represent mean ± SEM; dots represent individual animals (E, J). *p<0.05, **p<0.01, ***p<0.001, ****p<0.0001. See also: Figure 6—Video 1.


