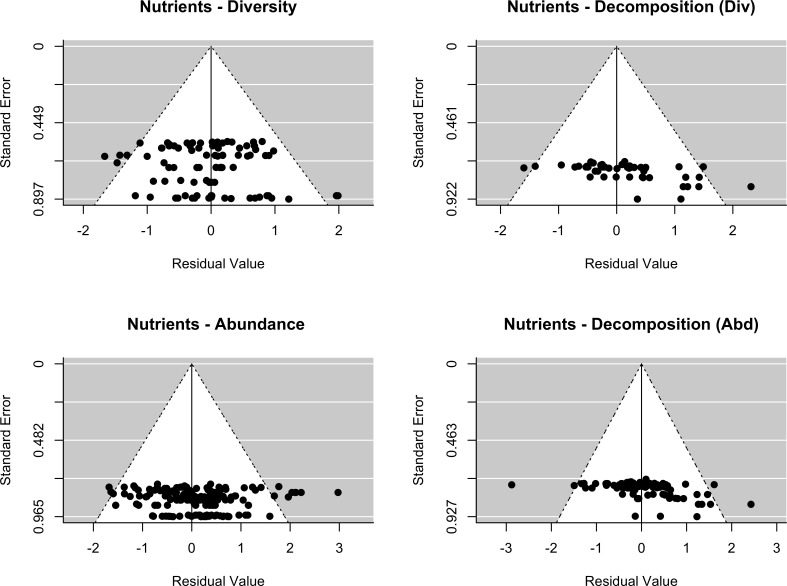
Appendix 2—figure 2. Assessment of publication bias.
Nutrients: Funnel plots of each response variables (decomposer diversity, abundance and decomposition) in the two datasets (stressors - diversity and stressors - abundance). Meta-analytic models included the effect of nutrient intensity (standardized levels) as a covariate.

