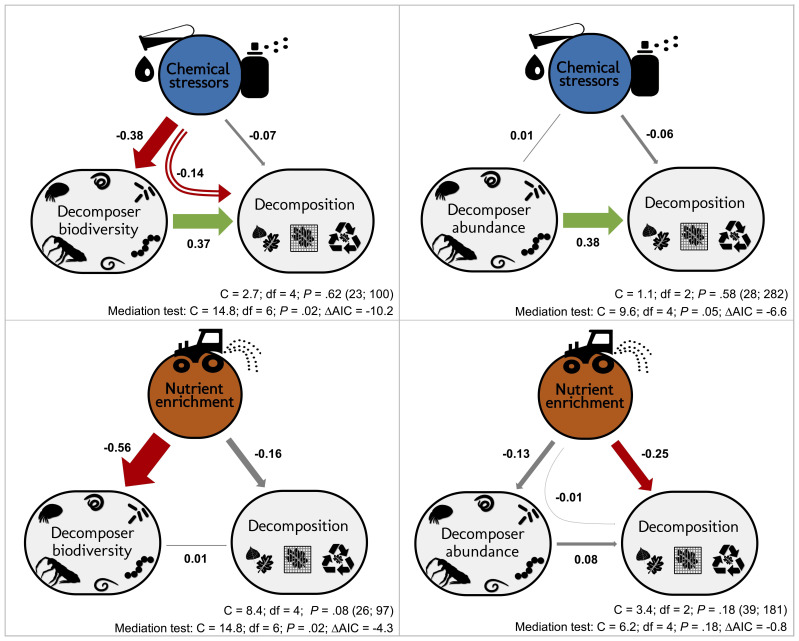
Figure 5. Decomposer diversity and abundance explained litter decomposition response to chemical stressors but not to nutrient enrichment.
Structural equation models investigating decomposer diversity- or abundance-mediated effects of chemical stressors and nutrient enrichment on litter decomposition across 69 studies. Arrows represent relationships between stressor or nutrient intensity levels, and effect sizes of stressors or nutrients on litter decomposition and on decomposer diversity (taxa richness, Shannon diversity, or evenness: left panels) or abundance and biomass (right panels). Values along the arrows are standardized path coefficients. Green, red, and gray arrows indicate positive, negative, and non-significant relationships, respectively. Curved arrows depict the indirect effects of stressors or nutrients on decomposition as mediated by diversity or abundance. Arrow widths are scaled relative to the magnitude of standardized path coefficients. C statistic, P-value (P<0.05 indicate poor model fit), and sample sizes (number of studies; number of observations). Results of mediation tests: comparison with models omitting the path from diversity or abundance to decomposition (ΔAIC < −2 indicates that reduced models were not consistent with the data).

