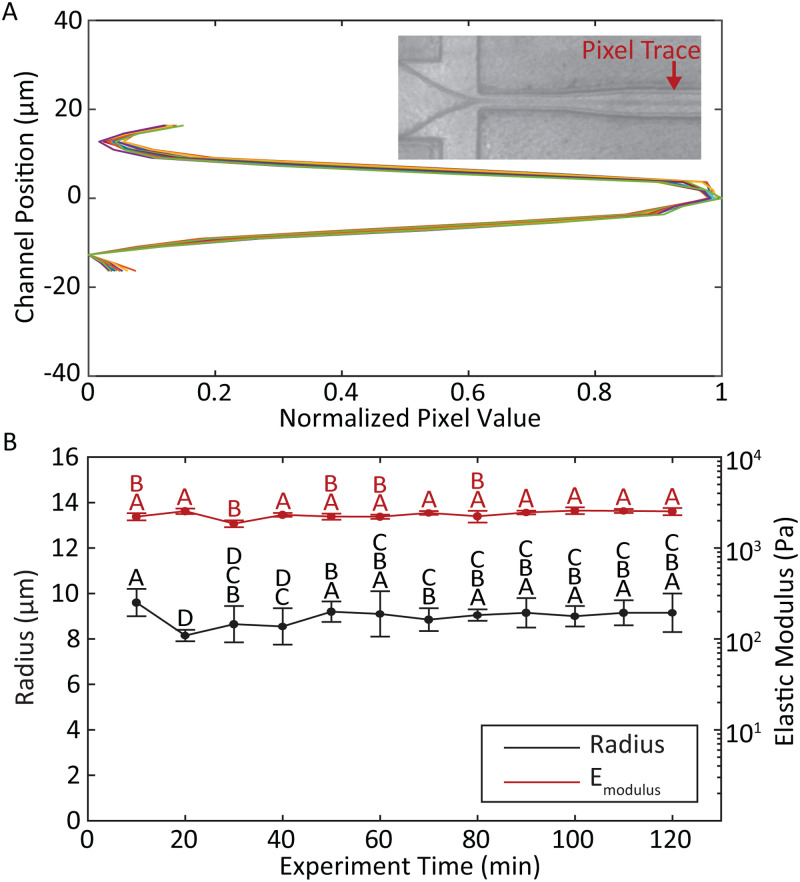
FIG. 6.
(a) Real-time measurement of the droplet size was obtained by plotting normalized pixel values across the channel at a fixed position downstream of the pinch-off point. Representative traces were taken at 10-min increments for the duration of the 2-h long MP production run. The closely overlapping traces indicate highly consistent droplet sizes over time (inset: sample screenshot of flow-focusing droplet generator indicating the location of pixel sampling). (b) Post-cure MP radius (black) and elastic modulus (red) with standard deviation for each 10-min sample group. Letters above data points indicate groups of statistical similarity ().

