Figure 5 (Continued).

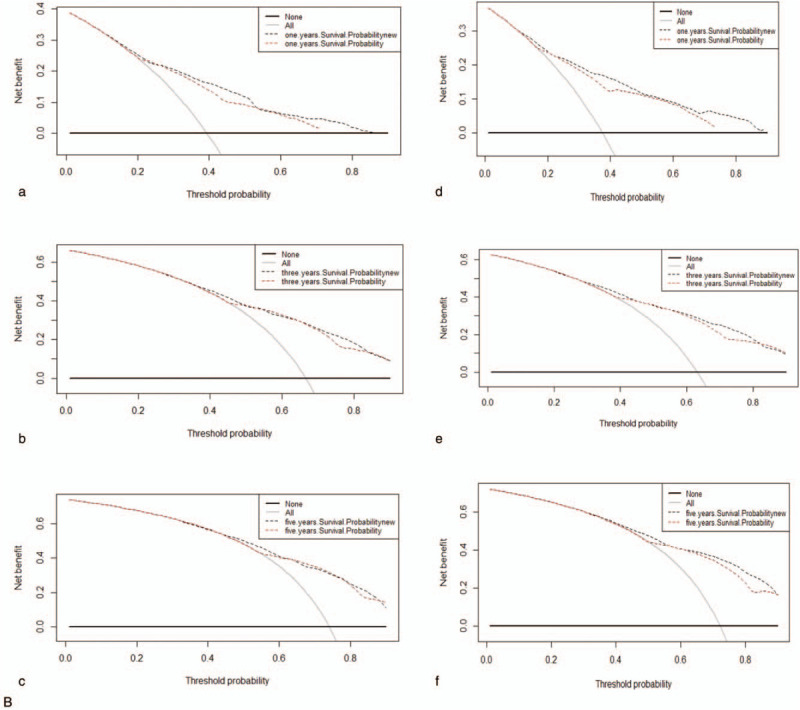
Decision curves for nomogram to predict mortality of GBAC in the training cohort (a, b, c) and in the validation cohort (d, e, f). (A) DOG cause-specific death, (B) other cause-specific death, and (C) overall death.

Decision curves for nomogram to predict mortality of GBAC in the training cohort (a, b, c) and in the validation cohort (d, e, f). (A) DOG cause-specific death, (B) other cause-specific death, and (C) overall death.