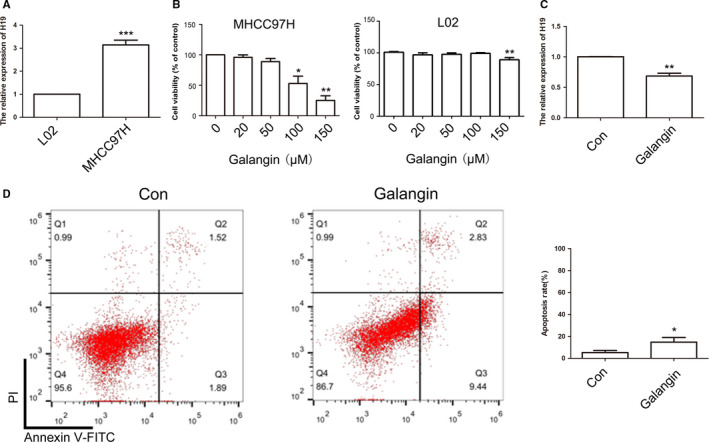
FIGURE 2.

Analysis of H19 expression and cell apoptosis after galangin treatment. Relative expression of H19 between L02 and MHCC97H cells (A). The cell growth was analyzed by CCK8 assay (B). Relative expression of H19 was analyzed by qPCR after galangin treatment in MHCC97H cells (C). The cell apoptosis was analyzed between Con and galangin group (D). Statistical analysis of the percentage of cell apoptosis (E). The data are represented as the mean ± SD (n = 3). *(P < .05), **(P < .01), and ***(P < .005) indicate statistically significant differences
