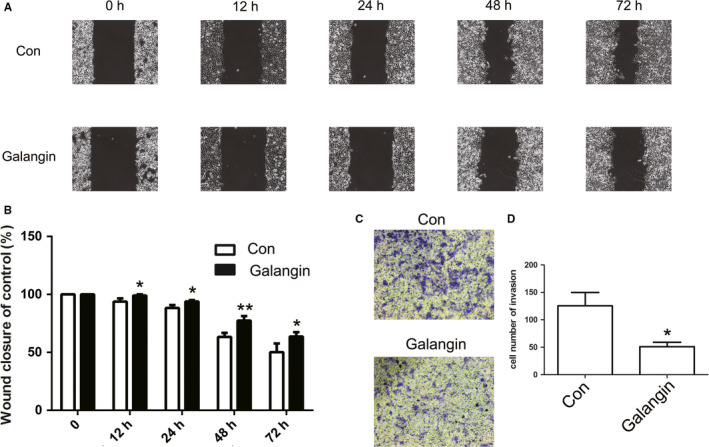
FIGURE 3.

Analysis of cell migration and invasion after galangin treatment. The cell migration was analyzed between Con and galangin group (A). Statistical analysis of the percentage of cell migration (B). The cell invasion was analyzed (C). Statistical analysis of the percentage of cell invasion (D). The data are represented as the mean ± SD (n = 3). *(P < .05) and **(P < .01) indicate statistically significant differences
