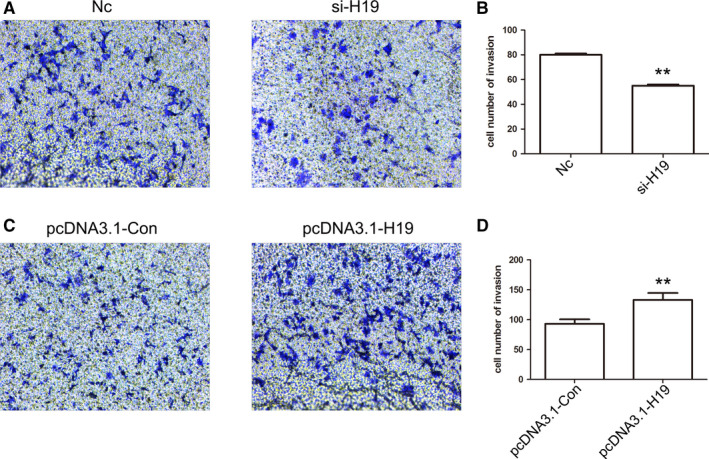
FIGURE 6.

Analysis of cell invasion after knockdown and overexpression of H19. The cell invasion was analyzed in Nc, si‐H19, pcDNA3.1‐Con, and pcDNA3.1‐H19 group (A and C). Statistical analysis of the percentage of cell migration (B and D). The data are represented as the mean ± SD (n = 3). **(P < .01) indicate statistically significant differences
