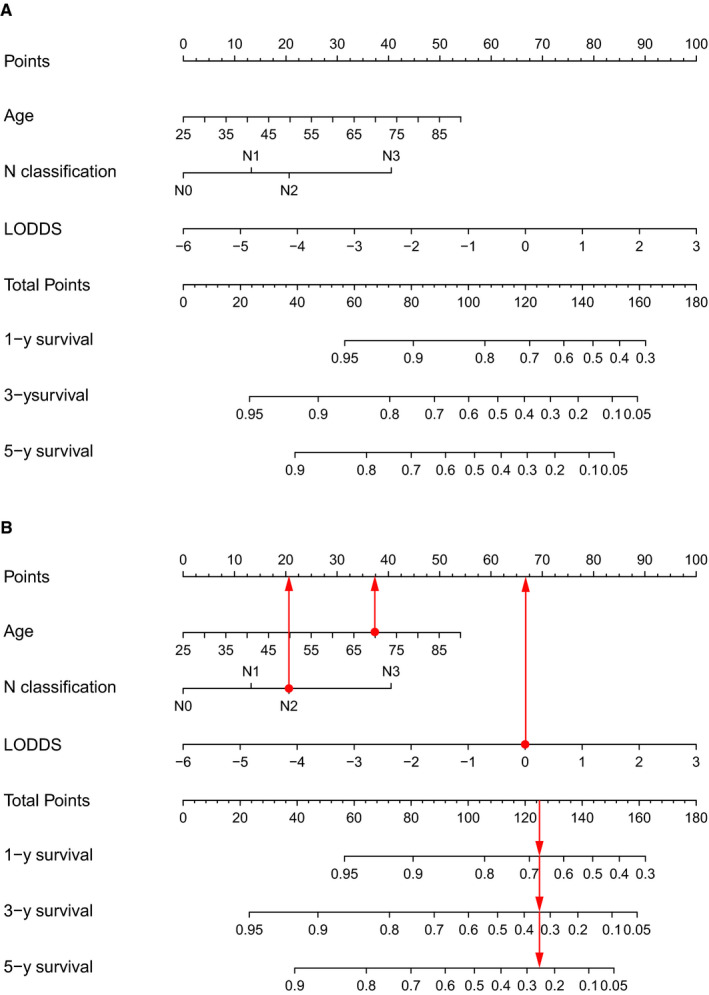
FIGURE 3.

The nomogram for predicting 1‐year, 3‐year, and 5‐year OS of patients with PSCC (A) and an example of using the nomogram (B). Each category of the prognostic variables was assigned a score based on the points scale. After summing up the score of each variable and locating the total score on the total points scale, a line was vertically drawn to the 1‐, 3‐, and 5‐year survival probability scale and estimated survival probability could be obtained
