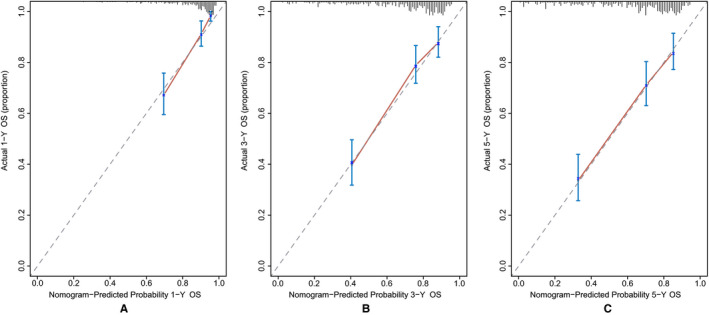
FIGURE 4.

The bias‐corrected calibration plots for predicting 1‐year (A), 3‐year (B), and 5‐year (C) OS of patients with PSCC (Bootstrap procedure with 1000 repetitions). The nomogram‐predicted probability of OS was plotted on the x‐axis, and actual OS was plotted on the y‐axis. The calibration plots could visually represent the relationship between the predicted risk and the actual absolute risk
