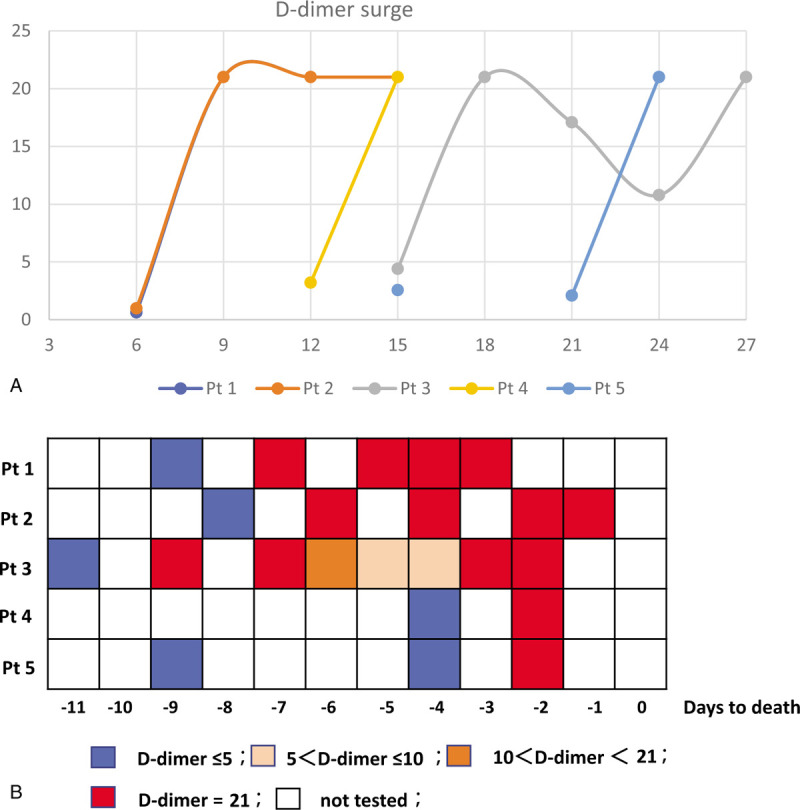
Figure 2.

D-dimer surge and its relation with in-hospital death in COVID-19 patients with cardiac injury. Panel A: D-dimer surge in 5 patients. Time is calculated since the onset of illness. Please note that the changes in the curves of D-dimer levels in patients 1 and 2 are highly coincident. Panel B: D-dimer level, D-dimer surge, and in-hospital death. Time is calculated since death. Different D-dimer levels are marked with different colors.
