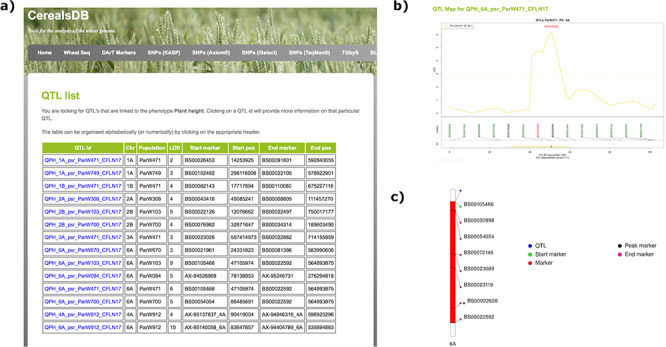
Figure 1.

Searching the QTL database for a particular phenotype generates a table (a) displaying all QTLs for that phenotype along with chromosomal positions, population information and LOD scores. Clicking on an individual QTL links to QTL maps (b) where markers are shown at the start and end of the confidence interval of the QTL along with the peak marker. An ideogram of the chromosome (c) is also displayed where available showing the QTL highlighted in red and the chromosomal position of important markers are also highlighted.
