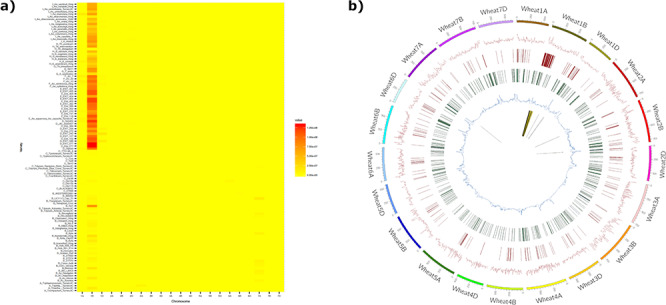
Figure 4.

The introgression plotter generates a heatmap and a circos plot in this example for the variety Brompton. The heatmap (a) plots total introgression size for each comparison with relatives ordered vertically by relatedness to bread wheat and chromosomes ordered horizontally. Users can zoom in on the heatmap for more detail. The circos plot (b) has a number of tracks: track 1 (innermost track), putative introgressed/deleted regions; track 2, SNP density for each wheat chromosome; track 3, CNV gain; track 4, CNV loss; track 5, minor allele frequency. The outermost track represents wheat chromosomes (500 = 500 Mbp). The Brompton wheat variety is known to have the 1B/1RS translocation and this can clearly be seen in the circos plot.
