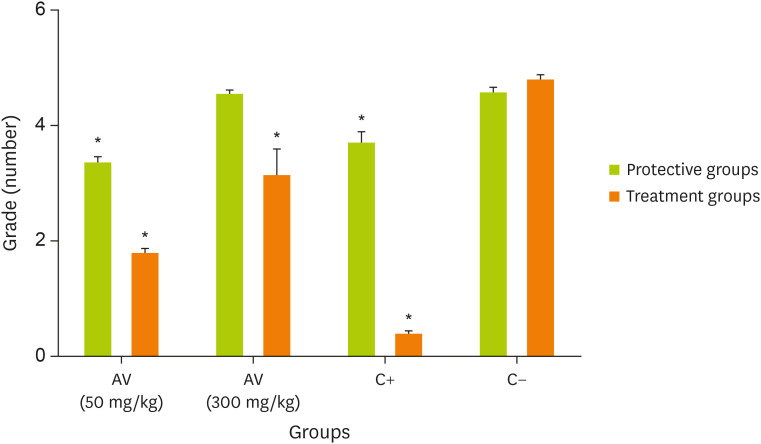
Figure 5. Scoring tissue damage based on Gerald method in protective and treatment groups. Values given are the mean ± standard error of means of 6 rats per group. To analyze the significance of the differences between the samples the authors used analysis of variance followed by the Tukey's test.
AV, Aloe vera.
*p < 0.05 vs. negative control group.

