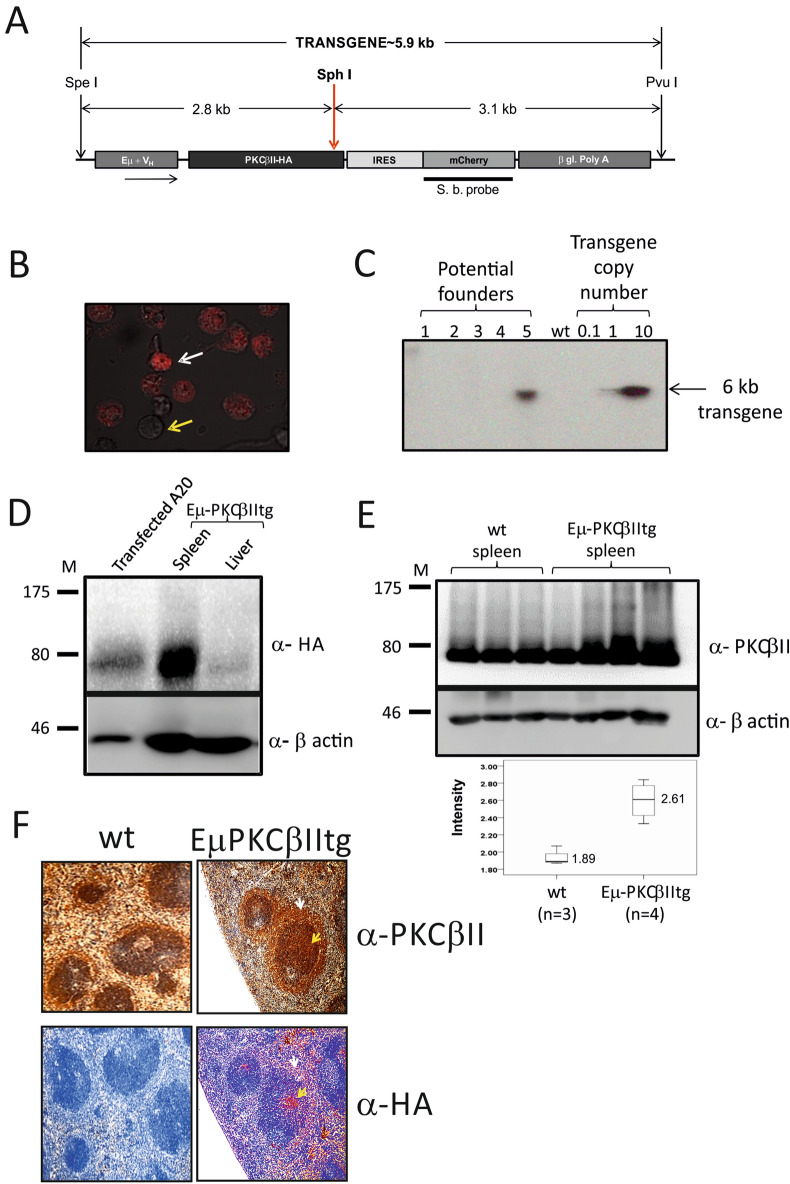
Figure 1.
Generation of Eµ-PKCβII transgenic mice. (A) Schematic representation of the plasmid construct (pEµ-PKCβII-IRES-mCherry) used to generate transgenic mice. (B) A20 cell line transfected with pEµ-PKCβII-IRES-mCherry plasmid using nucleofection. White arrow indicates fluorescent A20 cells that were succesfully transfected and express mCherry. Yellow arrow indicates those cells which did not take up the plasmid. (C) Southern blot analysis of genomic DNA isolated from tail cuttings of transgenic progeny to identify potential Eµ-PKCβIIItg founder mice. Copy number of the inserted gene was estimated by the accompanying standard curve of plasmid DNA. (D) Immunoblot analysis of protein extracted from splenic and liver tissue of homozygous Eµ-PKCβIItg mice. Western blots were performed using antibodies against HA (upper panel) or β-actin (lower panel). As positive control, protein lysates prepared from A20 cells that had been transiently transfected with pEµ-PKCβII-IRES-mCherry. (E) Upper and midde panel. Respective western blot analysis of PKCβII and β-actin expression in splenic tissue of wt (n = 3) and Eµ-PKCβIItg (n = 4) mice. Lower panel. Comparison of PKCβII expression in wt and Eµ-PKCβIItg mice. Expression of PKCβII was quantitated relative to β-actin. (F) Immunohistochemical staining of spleen sections from Eµ-PKCβIItg and wt mice with anti-HA (stained with Fast Red) and anti-PKCβII antibodies (brown with DAB). With respect to Eµ-PKCβIItg mice, the spleen sections are sequential where upper and lower images can be superimposed using the white arrow which points to the MZ and the yellow arrow which points to the follicle. The images in parts (C–E) have been cropped to efficiently show the relevant details, uncropped images can be viewed in the Supplementary information accompanying this manuscript. All elements of this figure have been published in the PhD thesis of AAA43.

