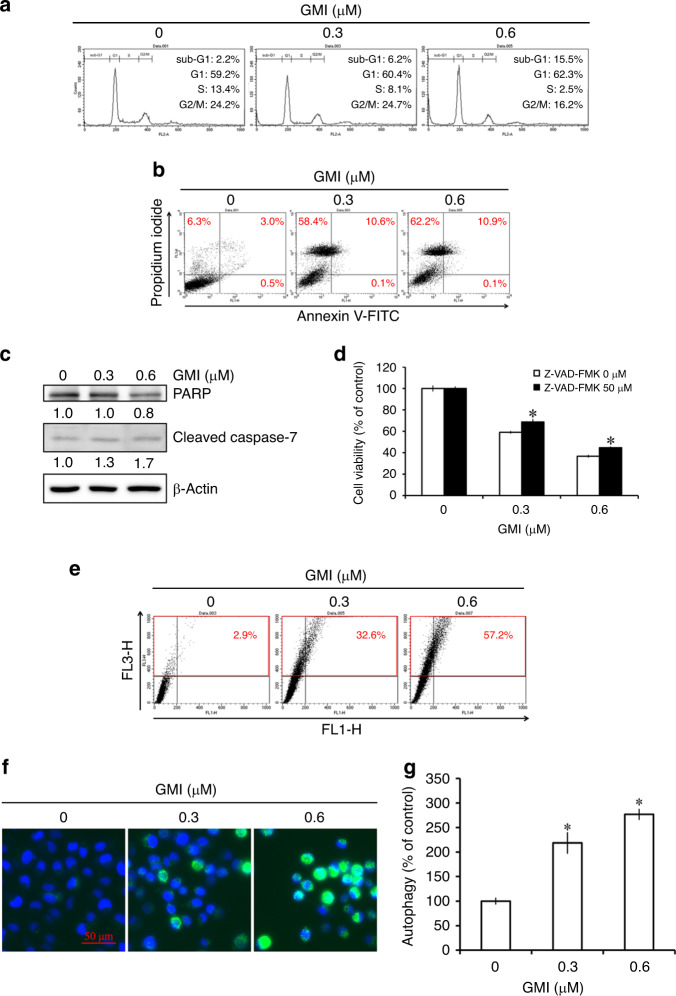
Fig. 2. Effect of GMI on cell cycle distribution and induction of apoptosis and autophagy in A549/A400 cells.
a A549/A400 cells (2 × 10⁵ cells of 60 mm dish) were treated with GMI (0, 0.3, and 0.6 μM) for 48 h. After PI staining, cells were analysed by flow cytometry. b After treatment with GMI (0, 0.3, and 0.6 μM) for 48 h, A549/A400 cells (2 × 10⁵ cells of 60 mm dish) were stained with annexin V-FITC/PI and analysed by flow cytometry. c A549/A400 cells (2 × 10⁵ cells of 60 mm dish) were treated with GMI for 48 h. Equal amounts of total cell lysates were analysed by Western blot assay. β-actin served as a loading control. d After GMI (0, 0.3, and 0.6 μM) and Z-VAD-FMK (0 and 50 μM) treatment for 48 h, MTT assay was performed to investigate the cell viability. e A549/A400 cells (2 × 10⁵ cells of 60 mm dish) treated with GMI (0, 0.3, and 0.6 μM) for 48 h were stained with acridine orange and analysed by flow cytometry. The upper right and upper left quadrants were quantified as AVO-positive cells. f After treatment of GMI for 48 h, A549/A400 cells (2 × 10³ cells/well of 96-well dish) were stained with CYTO-ID autophagy detection kit 2.0. The stained cells were investigated under a fluorescence microscope. Scale bar indicates 50 μm. g Fluorescence-activated A549/A400 cells were analysed with a fluorescence microplate reader. Results show the relative change in fluorescence strength, and the fluorescence strength of A549/A400 cells without treatment was set at 100%. The symbol ‘*’ indicates P < 0.05.

