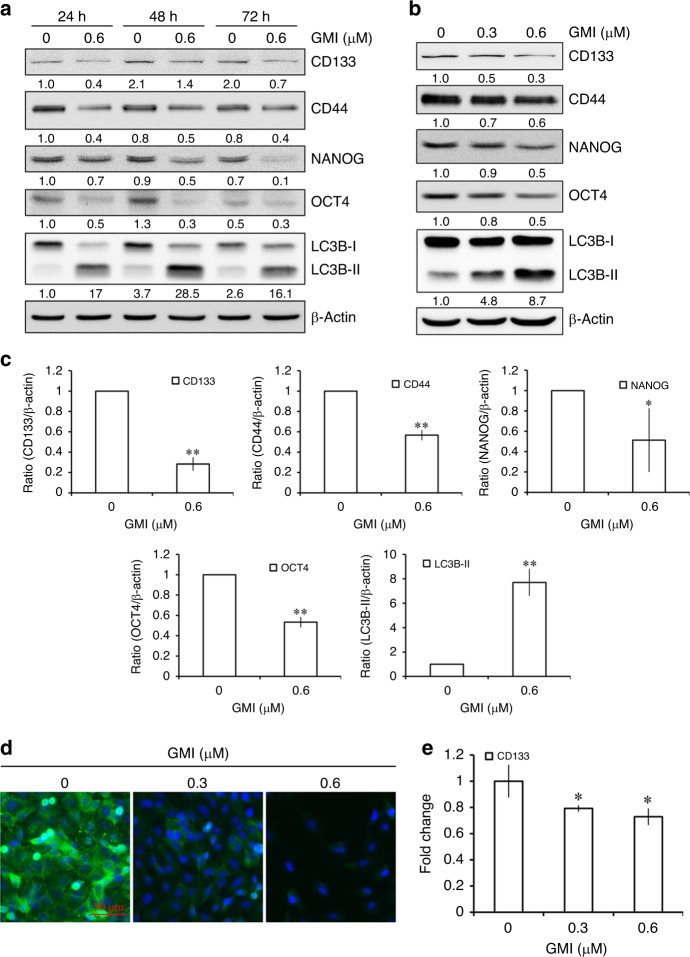
Fig. 3. Effect of GMI on stemness genes in A549/A400 cells.
a A549/A400 cells (2 × 10⁵ cells of 60 mm dish) were treated with GMI for indicated times. Equal amounts of total cell lysates were analysed by Western blot assay. β-actin served as a loading control. b CD133, CD44, NANOG, OCT4, LC3B, and β-actin were determined by Western blot after A549/A400 cells (2 × 10⁵ cells of 60 mm dish) treated with GMI (0, 0.3, and 0.6 μM) for 72 h. c Statistical analysis of Western blots. The band intensities of CD133, CD44, NANOG, OCT4, and LC3B-II were quantified using software ImageJ and standardised by β-actin. The ratio of cells without GMI treatment was set at 1. The symbols ‘*’ and ‘**’ indicate P < 0.05 and P < 0.001, respectively. d A549/A400 cells (2 × 10⁵ cells of 60 mm dish) were treated with GMI (0, 0.3, and 0.6 μM) for 72 h and then stained with anti-CD133 antibody. Scale bar indicates 50 μm. e Total RNA was collected from A549/A400 cells (2 × 10⁵ cells of 60 mm dish) after treating with GMI (0, 0.3, and 0.6 μM) for 72 h. RT-qPCR was performed to analyse the mRNA expression of CD133. The symbol ‘*’ indicates P < 0.05.

