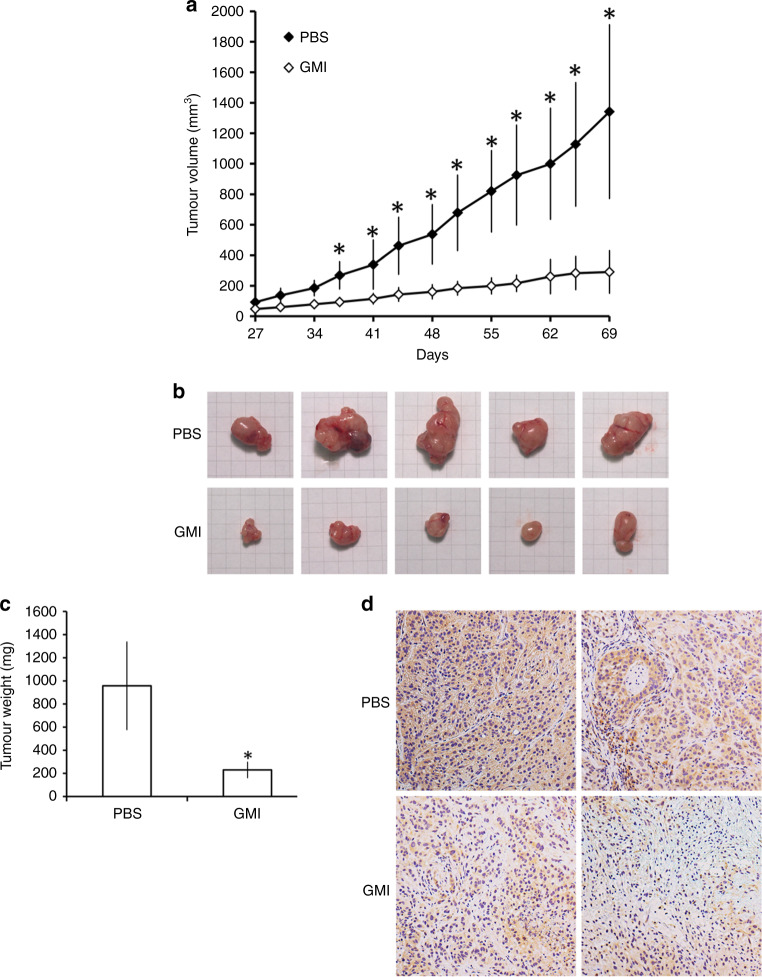
Fig. 6. Effect of GMI on A549/A400 cell xenograft tumour growth in nude mice.
a A549/A400 cells (approximately 5 × 10⁶) were injected subcutaneously into each left flank of nude mice to initiate tumour growth. At 7 days after implanting the cells, the PBS group started to receive sterilised PBS, whereas the mice in GMI group received GMI protein (160 μg/mouse, N = 5, respectively). PBS and GMI proteins were administered to mice by gavage once every day. At 27 days after cell transplantation, tumour sizes were measured every 3 or 4 days and the tumour volume was calculated. The symbol ‘*’ indicates P < 0.05 for the tumour volume of the PBS group when compared with the tumour volume of the GMI group at the same time-point. b Tumour images of the PBS and GMI groups. c Tumour weights were measured after the mice were sacrificed at day 69. The symbol ‘*’ indicates P < 0.05. d IHC staining was performed to investigate CD133 expression in tumours of the PBS and GMI groups.

