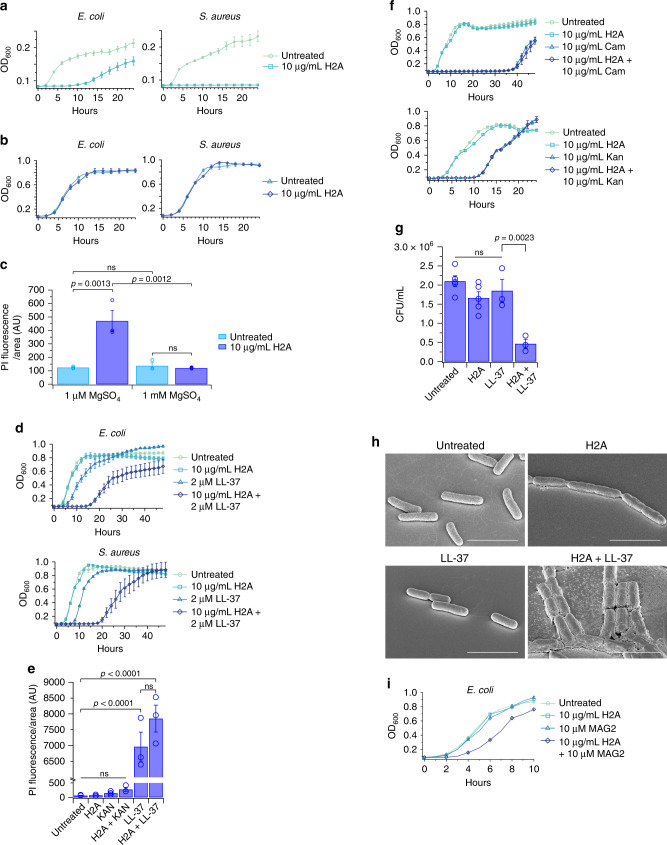
Fig. 1. Histones and the antimicrobial peptides LL-37 and magainin-2 increase killing efficacy against bacteria.
a, b Growth profiles, measured by optical density, of E. coli and S. aureus treated with H2A in media containing a low (1 μM) magnesium (n = 33 for each condition) and b physiological (1 mM) magnesium (n = 11 for each condition). c Intracellular propidium iodide (PI) fluorescence intensities of H2A-treated E. coli in 1 μM and 1 mM concentrations of magnesium after 1-h treatment (n = 3 for each condition). d Growth profiles of E. coli (n = 18 for each condition) and S. aureus (n = 8 for each condition) treated with 10 μg/mL H2A, 2 μM LL-37, or both in medium containing 1 mM magnesium. e Intracellular propidium iodide (PI) fluorescence intensities of E. coli treated with 10 μg/mL H2A, 2 μM LL-37, both H2A and LL-37, 10 μg/mL kanamycin (Kan), or H2A and Kan, in medium containing 1 mM magnesium (n = 3 for each condition). PI fluorescence of LL-37-treated E. coli and Kan-treated E. coli was normalized to H2A-treated cells. f Growth profiles of E. coli treated with 10 μg/mL H2A, H2A and 10 μg/mL chloramphenicol (Cam), or H2A and 10 μg/mL Kan in medium containing 1 mM magnesium (n = 6 for each condition). g Colony-forming units (CFU) of E. coli that were untreated (n = 5) or treated with 10 μg/mL H2A (n = 5), 2 μM LL-37 (n = 3), or both (n = 3) in minimal medium containing 1 mM magnesium. Bacteria were treated for 1 h before plating on non-selective LB agar plates. CFUs were normalized to H2A-treated E. coli CFUs in Supplementary Fig. 1A. h Scanning electron microscopy (SEM) images of E. coli treated with 10 μg/mL H2A, 1 μM LL-37, or both in medium containing 1 mM magnesium (n = 3 for each condition). i Growth profiles of E. coli treated with 10 μg/mL H2A, 10 μM MAG2, or both in medium containing 1 mM magnesium (n = 4 for each condition). Data shown as mean ± standard error of the mean (SEM) and are representative of biologically-independent experiments. One-way ANOVAs were performed. No adjustments were made for multiple comparisons. ns > 0.05. Scale bars represent 3 μm.

