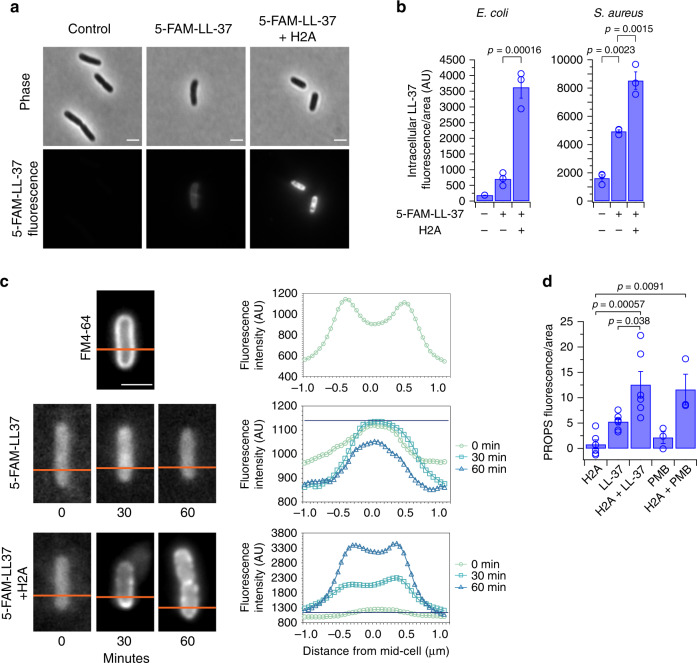
Fig. 3. Histone H2A increases the intracellular uptake of LL-37, localizes LL-37 to the membrane, and disrupts the proton gradient with LL-37.
a Fluorescence and phase-contrast images of E. coli that were untreated or treated with fluorescently-tagged LL-37 (5-FAM-LC-LL-37) alone or in combination with 10 μg/mL H2A. 5-FAM-LC-LL-37 is mixed with unlabeled LL-37 (1% 5-FAM-LC-LL-37, combined concentration of 2 μM) to decrease fluorescence intensity. b Intracellular fluorescence intensities of untreated E. coli and S. aureus or treated E. coli and S. aureus with 5-FAM-LC-LL-37 alone or in combination with 10 μg/mL H2A (n = 3 for each condition). Fluorescence intensities were measured after a 1-h period. c Representative images and associated fluorescence intensity profiles of E. coli that were treated with 1% 5-FAM-LC-LL-37 alone or in combination with 10 μg/mL H2A for 0, 30, or 60 min. The profiles are taken along the lines indicated in orange. The maximum fluorescence intensity of the 5-FAM-LL-37-treated cells (without H2A) is indicated by a horizontal blue line. Cell membranes were visualized using FM4-64. d Intracellular fluorescence intensities of E. coli containing the proteorhodopsin optical proton sensor (PROPS) plasmid pJMK001, which measures membrane potential. Fluorescence intensities were measured after a 1-h treatment with 10 μg/mL H2A, 1 μM LL-37, or both H2A and LL-37 (n = 6 for each condition); or with 1 μg/mL PMB or H2A and PMB (n = 3 for each condition). Bars indicate mean ± SEM of biologically-independent experiments. One-way ANOVAs were performed. No adjustments were made for multiple comparisons. Images are representative of three independent experiments. Scale bars represent 2 μm.

