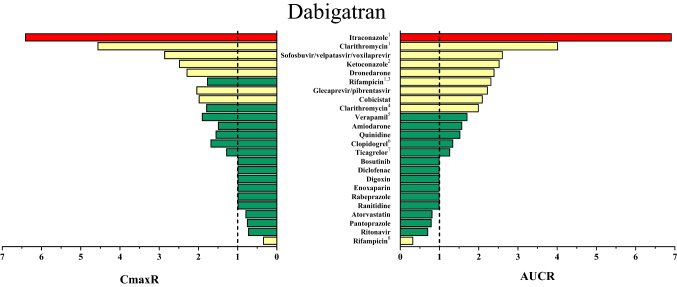
Fig. 4.
Area under the concentration–time curve (AUC) ratios (AUCR) and maximum (peak) concentration (Cmax) ratios (CmaxR) of dabigatran with and without concomitantly taken drugs. Results of drug–drug interaction (DDI) trials that have been conducted and published up to January 2020 are depicted [23, 52, 70, 71, 102–113]. A ratio equals 1 if the co-administered drug statistically insignificantly influenced direct oral anticoagulant (DOAC) pharmacokinetics. Green bars: AUCR and CmaxR > 0.5 and < 2. Yellow bars: AUCR and CmaxR ≤ 0.5 and ≥ 2. Red bars: AUCR and CmaxR ≥ 5. 1DOAC microdoses administered. 2Ketoconazole 200 mg investigated. 3A single dose of rifampicin was provided. 4The figure depicts the greatest effect of clarithromycin on dabigatran pharmacokinetics that has been reported. Results from DDI trials are ambiguous. Although the same dose of clarithromycin was administered, one trial did not observe any change in dabigatran exposure and the other reported a smaller AUCR than depicted (AUCR 1.49) [103, 105]. 5Verapamil was provided in an extended-release formulation. Immediate-release verapamil given 1 h before dabigatran etexilate had greater impact on dabigatran exposure. Immediate-release verapamil given 2 h after dabigatran etexilate did not alter dabigatran exposure to a relevant extent. 6Only loading doses of clopidogrel (300–600 mg) affected dabigatran exposure. 7Loading doses of ticagrelor (180 mg) administered 2 h after dabigatran etexilate 110 mg or maintenance doses of ticagrelor (90 mg) administered concomitantly increased dabigatran exposure as depicted. Lower doses of dabigatran etexilate (75 mg) were affected to a greater extent by ticagrelor (AUC 1.73-fold, Cmax 1.95-fold). 8Rifampicin was given repeatedly

