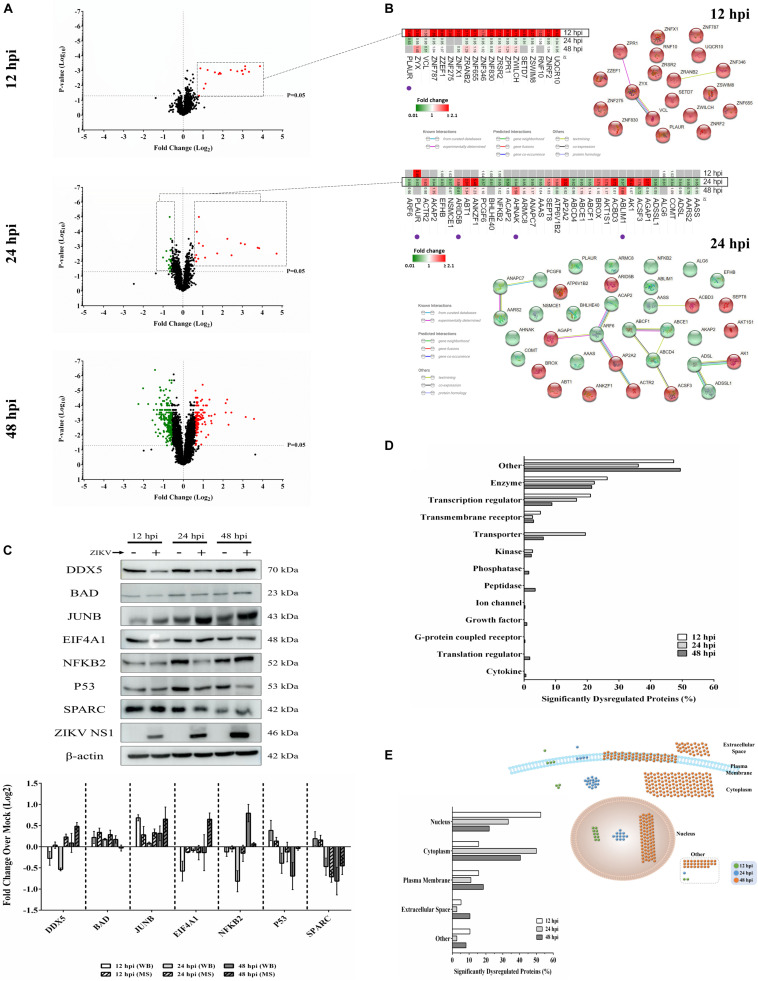
FIGURE 1.
Mass spectrometry proteomic analysis of ZIKV-infected Vero cells. (A) Volcano plots displaying ZIKV-induced log2–fold protein level changes and significance of differentially regulated proteins at 12 (upper panel), 24 (middle panel), and 48 (lower panel) hours post-infection (hpi) (p-value < 0.05). (B) The quantitative comparison heatmaps indicating fold changes and protein-protein interaction networks of differentially dysregulated proteins across two time points (12 and 24 hpi). The protein-protein interaction network of the large number of differentially dysregulated proteins at 48 hpi is shown in Supplementary Figure S1. Proteins labeled with purple dots below heatmaps were significantly differentially expressed in the opposite direction at either earlier or later time points. (C) Western blot validation of selected differentially dysregulated proteins from mass spectrometry results. Representative blots are shown. Different loading controls were used for the densitometry normalization and analysis. Protein fold changes and availability of antibodies were taken into account for validation. ZIKV NS1 was probed to confirm the infection. (D) Classification of significantly dysregulated protein type at different time points after ZIKV infection. (E) The subcellular localizations of dysregulated proteins at different time points represented both quantitatively (left panel) and graphically (right panel).

