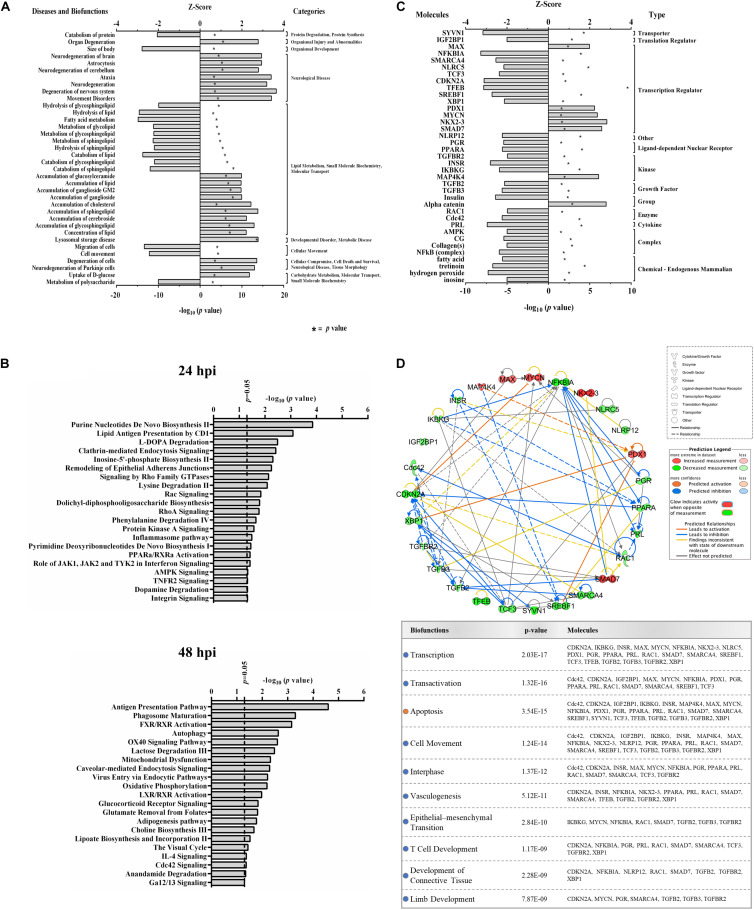
FIGURE 2.
Proteomic prediction of top affected bio-functions, canonical pathways, and upstream molecules in Vero cells after ZIKV infection. (A) Predicted activation or inhibition patterns of top affected bio-functions at 48hpi based on Z-scores (upper x–axis) and log10 p–values (lower x–axis indicated by asterisk). Influenced bio-functions are grouped using major parental categories of functions (shown at right). (B) Prediction of top affected canonical pathways by ZIKV at 24 (upper panel) and 48 (lower panel) hpi. (C) Prediction of top affected upstream molecules and their possible activation or inhibition based on expression patterns of downstream proteins at 48 hpi. (D) Interaction network of top predicted upstream molecules (upper panel) and their related bio-functions (table in lower panel). Activation or inhibition patterns of connected bio-functions and interaction types of predicted molecules are measured according to Z-scores calculated from IPA software, which is based on the expression of differentially regulated downstream proteins at 48 hpi.

