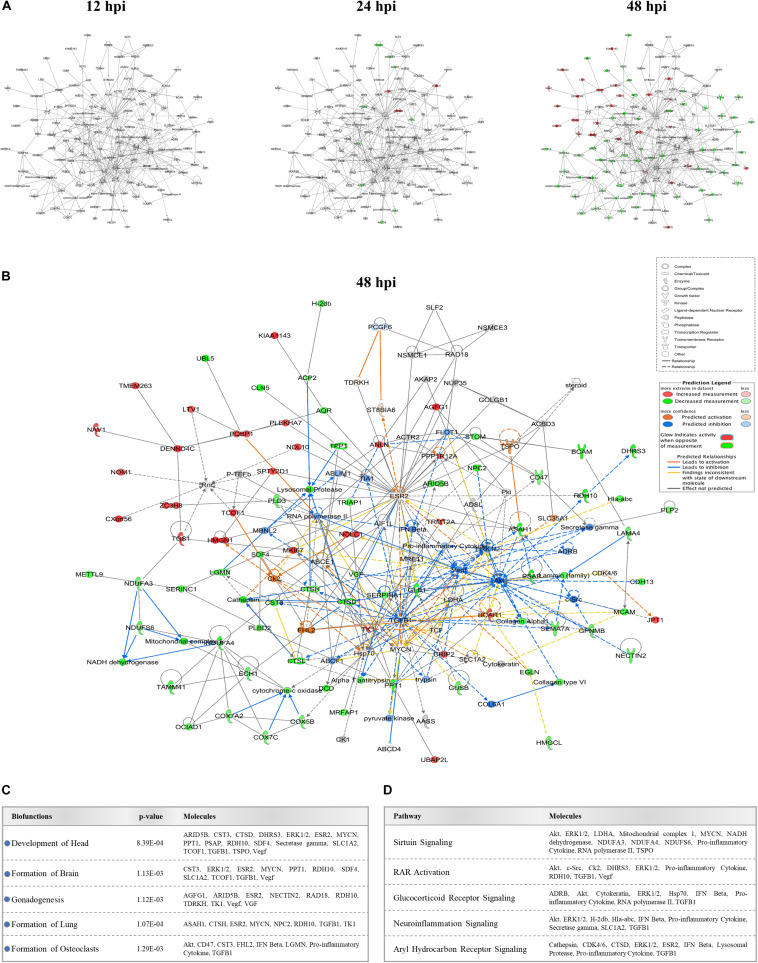
FIGURE 3.
Effect of ZIKV infection on protein-protein interaction network of developmental abnormalities. (A) Alterations in the levels of proteins controlling developmental abnormalities network across three time-points. Higher and lower ZIKV-induced protein levels are represented in red and green, respectively; gray proteins denote that they were recognized in the present study but not significantly regulated; colorless proteins interact with molecules in the network but were not identified in our study. (B) IPA prediction of the protein regulation patterns that belong to developmental abnormality interaction networks but were either not differentially expressed or identified in our study. This prediction model was established through overlaying proteomic data at 48hpi onto the merged developmental abnormality network. Molecules shown in orange and blue represent predictions for activation and inhibition, respectively. (C) Selection of specific bio-functions that were predicted to be inhibited based on ZIKV-mediated changes in molecules regulating this network. (D) List of top-affected canonical pathways that could be connected to member proteins of developmental abnormalities network.

