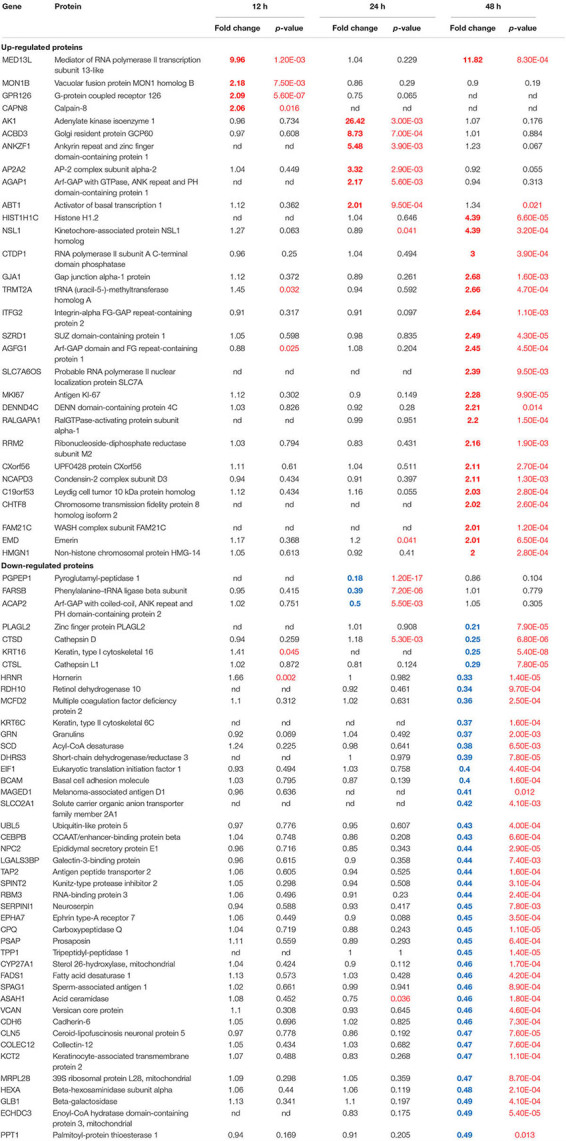
TABLE 2.
Vero cell proteins dysregulated ≥2.0-fold by ZIKV infection.
 |
Only proteins dysregulated ≥ 2.0-fold are listed. All proteins are listed in Supplementary Table S1. Entries are sorted, first by time, from 12 to 48 hpi, then by degree of dysregulation within each set. Values determined from three biological replicates. Proteins with significant p-value are red in T-Test column, those significantly up-regulated are shown in bold red and those significantly down-regulated are shown in bold blue. n.d. = not detected.
