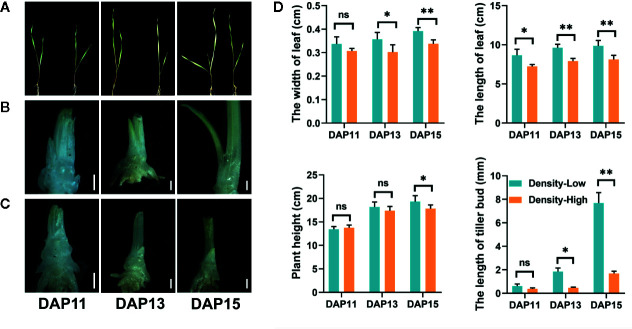
Figure 1.
(A) Image of Aegilops tauschii Coss seedlings at low (left) and high (right) plant density at 11 (DAP11), 13 (DAP13), and 15 (DAP15) days after planting. (B–C) Growth status of tiller buds located in the axil of the first leaf at low (B) and high (C) plant density at DAP11, DAP13, and DAP15. The scale bar represents 1 mm. (D) The width and length of the first leaf, plant height, and length of tiller buds located in the axil of the first leaf at low and high plant density at DAP11, DAP13, and DAP15. Means and their SDs from three biological replicates are shown. Ns, no significance; *P < 0.05; **P < 0.01.

