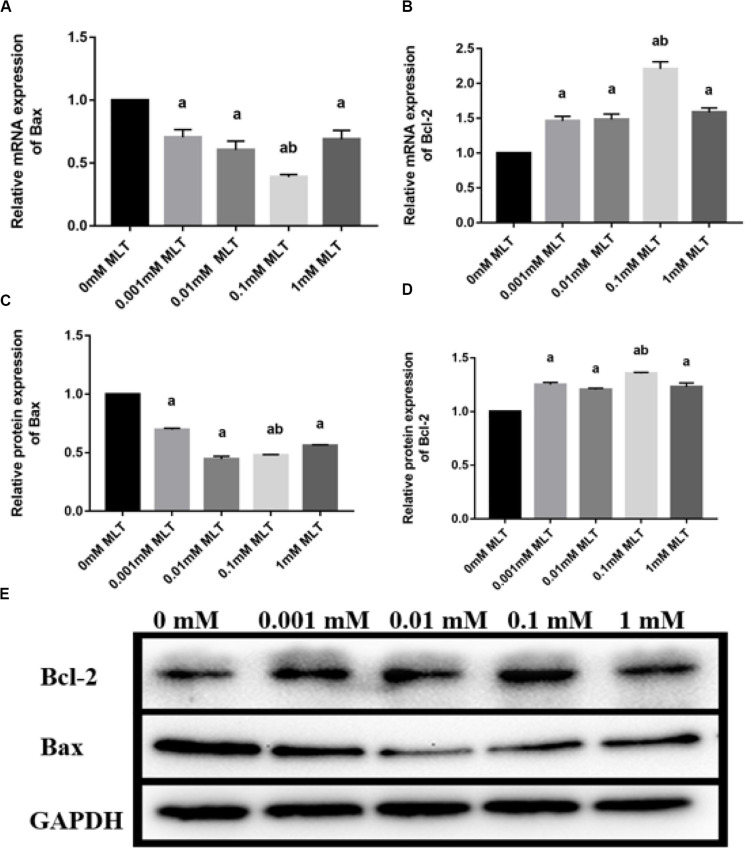
FIGURE 3.
Effect of MLT on mRNA and protein expressions of Bax and Bcl-2 in cryopreserved OTs. (A) Relative mRNA expressions of Bax in each MLT-(un)treated group. (B) Relative mRNA expressions of Bcl-2 in each MLT-(un)treated group. (C) Protein expressions of Bax in each MLT-(un)treated group. (D) Protein expressions of Bcl-2 in each MLT-(un)treated group. (E) Representative Western blot image of Bax and Bcl-2 in each MLT-(un)treated group. Data are shown as the mean ± SEM. a P < 0.05 compared with the 0-mM MLT-untreated group; b P < 0.05 compared with the MLT-treated group.

