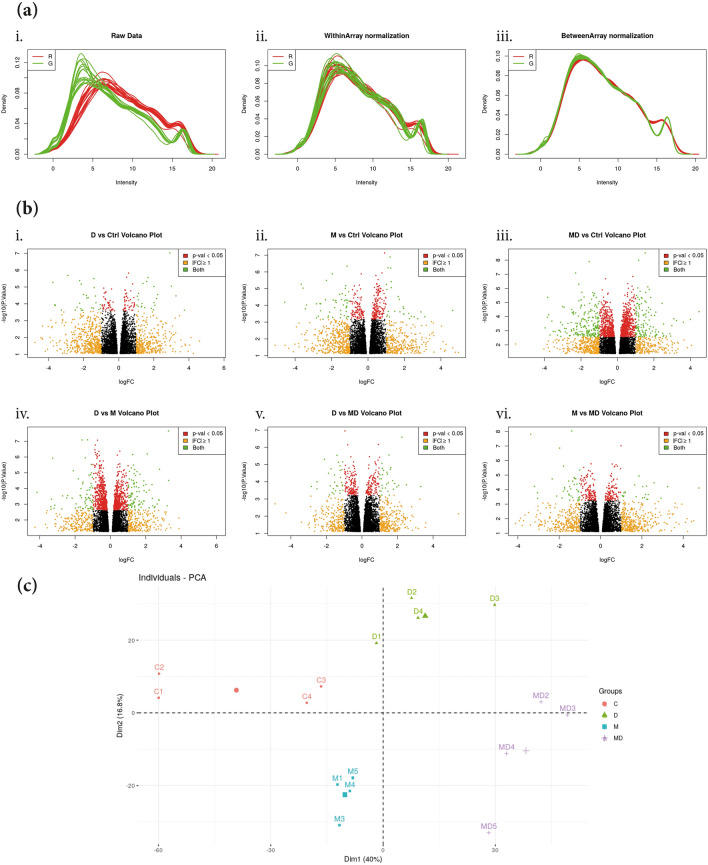
Figure 2.
Validation of the DEGs profiles. (a) Normalization graphs from the raw data (i) was performed within (ii) and between (iii) groups. (b) Volcano plots comparing the levels of genes expressions between the experimental groups (i) DSS vs control; (ii) MPTP vs control; (iii) MPTP + DSS vs control; (iv) DSS vs MPTP; (v) DSS vs MPTP + DSS and (vi) MPTP vs MPTP + DSS. (c) PCA plot for the four experimental groups of interest (control, DSS, MPTP and MPTP + DSS).

