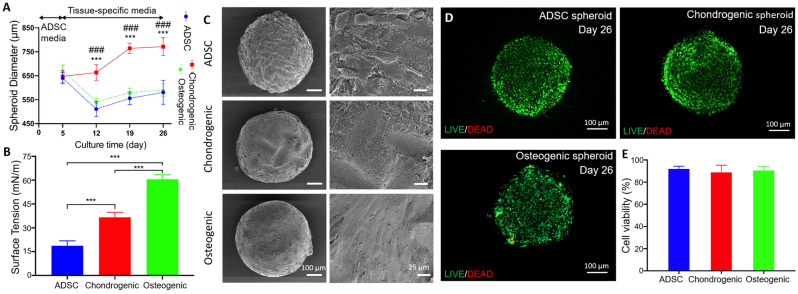
Figure 1.
Structural, mechanical, and cell viability analysis of spheroids: (A) Diameter change over 26 days (n = 8,***p < 0.001 shows significance between ADSC and chondrogenic spheroids, and ###p < 0.001 shows significance between osteogenic and chondrogenic spheroids), (B) surface tension at Day 26 (n = 5, ***p < 0.001), and (C) SEM images of ADSC, chondrogenic and osteogenic spheroids. (D) LIVE/DEAD images (E) and cell viability in ADSC, chondrogenic, and osteogenic spheroids at Day 26.

