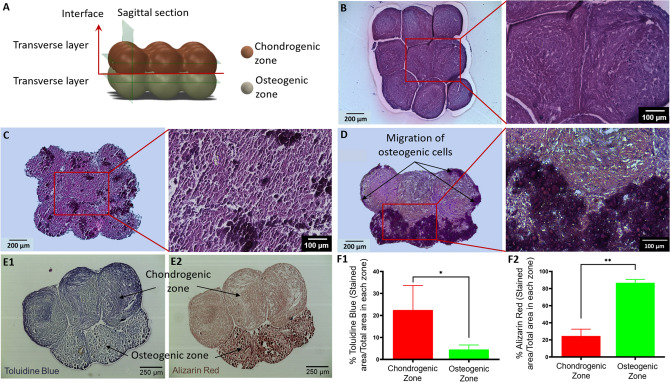
Figure 6.
(A) A schematic diagram showing positions of histological sectioning in the construct. (B-D) H&E staining of the chondrogenic, and osteogenic zones, and the interface. Histomorphological characteristics of the bioprinted OC interface indicated by (E1) Toluidine Blue and (E2) Alizarin Red staining. Quantification of stained areas for Toluidine Blue (F1) and Alizarin Red (F2) in chondrogenic or osteogenic zones (n = 4, *p < 0.05 and **p < 0.01).

