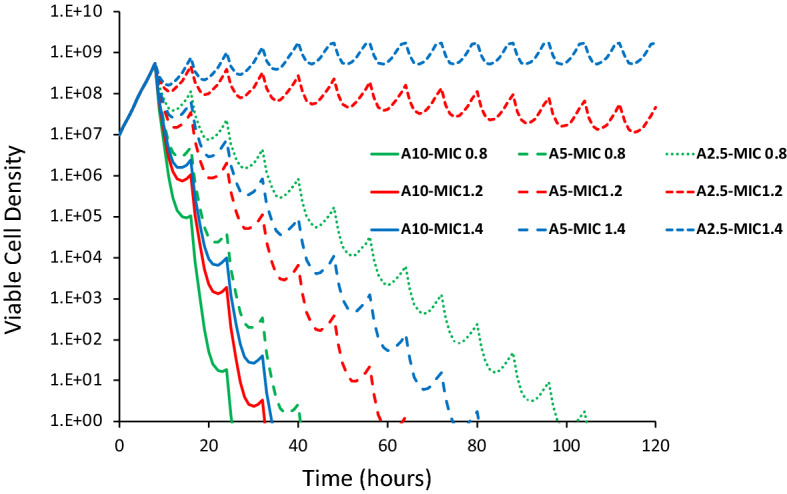
Figure 5.

Simulation results of the relationship between the dose of the antibiotic and MIC. Simulations were made of treatment every 8 h with a drug (10, 5 and 2.5 µg/ml) of cells with the MIC of 0.8, 1.2 and 1.5 µg/ml of the drug and the changes in the viable cell density observed. Hill function parameters VMAX = 1.0, VMIN = − 3.0, κ = 1.0, continuous culture parameters, k = 1, e = 5 × 10⁻⁷, w = 0.5 and C = 1,000 (see the equations in the “Materials and methods” section. See supplemental Figure S2 for the pharmacodynamic Hill functions and the rates of kill bacteria exposed to antibiotics with these Hill function parameters.
