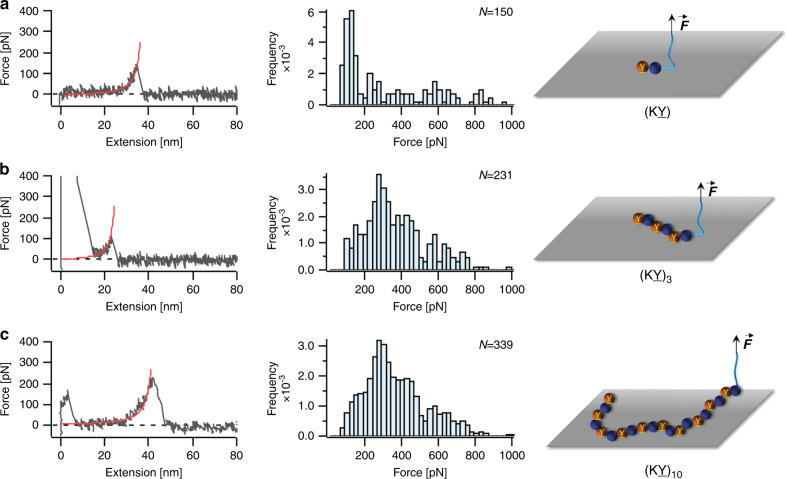
Fig. 3. SMFS results for the interaction of (KY), (KY)3, and (KY)10 peptides with TiO2.
Representative F–X curves (left column) and rupture force distribution (middle column) are shown for a (KY), b (KY)3, and c (KY)10. N values represent the total number of rupture events used to plot the histograms. The red lines on the F–X curves correspond to WLC fitting. Right column shows schematic illustration of the peptides interacting with the substrate. Source data are provided as a Source data file.

