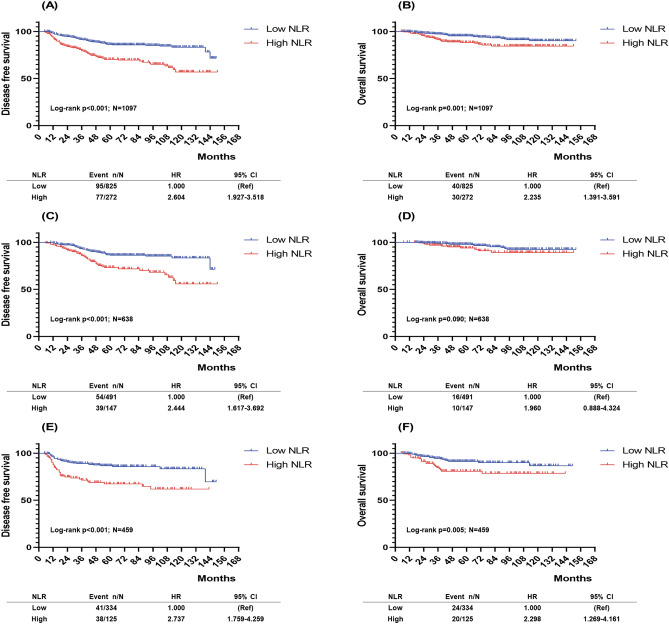
Figure 2.
Prognostic ability of the baseline NLR. Kaplan–Meier curves of (A) DFS in all patients, (B) OS in all patients, (C) DFS in HR+HER2− breast cancer, (D) OS in HR+HER2− breast cancer, (E) DFS in TNBC, (F) OS in TNBC, DFS disease-free survival, OS overall survival, HR hormone receptor, HER2 human epidermal growth factor receptor 2, TNBC triple-negative breast cancer. All graphs were prepared using the software Graphpad Prism Version 8 (GraphPad Software, USA, https://www.graphpad.com/scientific-software/prism/).

