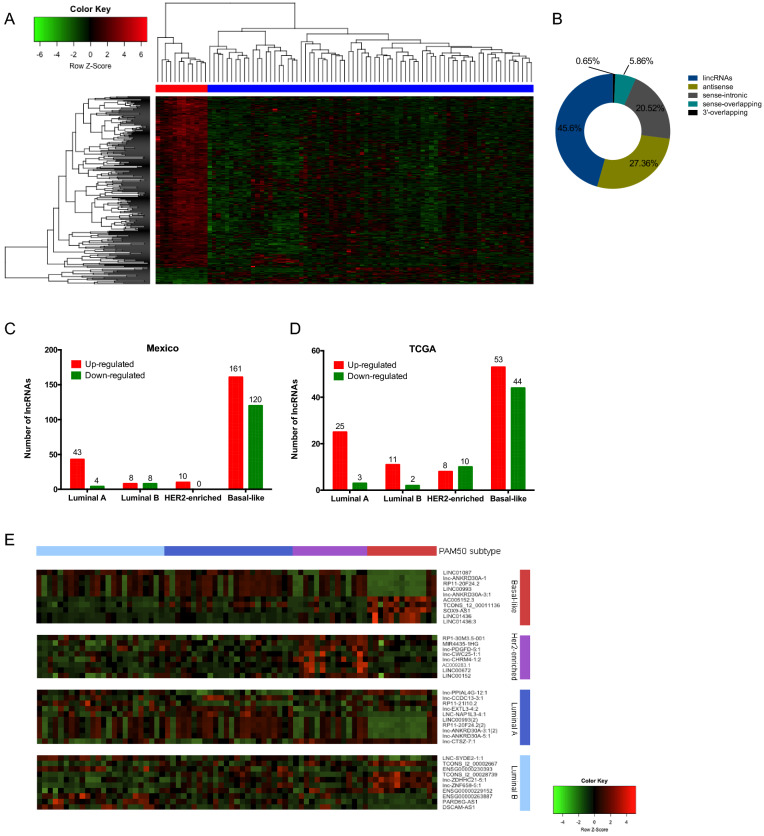
Figure 1.
(A) Supervised hierarchical cluster analysis of the expression of the 307 lncRNAs deregulated in breast tumor (blue) and normal tissue (red). (B) Classification of lncRNAs deregulated between tumor and adjacent tissues, grouped based on their genomic localization by intersection with protein-coding genes. (C) lncRNAs deregulated across molecular subtypes in the Mexican cohort (fold change > 1.5, < − 1.5, FDR < 0.05) and (D) in the TCGA project (Fold change log 1.0. adj. p-value < 0.05). (E) Top ten lncRNAs deregulated across molecular subtypes in the Mexican cohort. Basal-like in red, Her2-enriched in purple, Luminal A in blue and Luminal B in cyan. Each column represents a sample and each row a lncRNA.

